Tapping into Tableau: Empowering Data‑First Marketing Analytics
In today’s data-driven landscape, the ability to seamlessly integrate and visualize data from a myriad of sources is paramount to informed decision-making and strategic planning. Tableau stands at the forefront of this innovation, offering a robust platform that simplifies the complexity of data analytics through intuitive visualizations and AI-powered insights.
By integrating insights from multiple data sources, marketers gain a comprehensive understanding of customer journeys and crucial business metrics—insights that traditionally would require a large team of data scientists to reveal. With Tableau's data visualization tools, marketers can easily visualize the critical connections within their data, revealing what drives customers to convert.
Salesforce is constantly enhancing Tableau with innovative features, including GenAI capabilities, to empower marketers to make more informed, data-driven decisions. We are confident that these advancements will unveil untapped opportunities, allowing marketers to achieve greater results more efficiently.
Data Connectivity with Tableau
Data can come from anywhere and everywhere, and it can be structured, semi-structured, and unstructured. To utilize this data to its fullest, Tableau blends multiple data sources into one visual medium for data exploration without needing advanced developer skills. Data visualization allows for easy decision-making and data interpretation. This makes data more accessible across your organization, allowing stakeholders to better understand patterns and key business insights. According to the most recent Salesforce State of Data Analytics Report, 79% of analytics leaders are looking to invest more in data visualization tools.
With nearly 100 built-in data sources or API connectors, Tableau’s plug-and-play capabilities give teams quick, reliable access to their data, allowing organizations to connect and visualize within minutes. Including connections from powerful analytics tools like Google Analytics, Google BigQuery, Amazon Redshift, and even Internal Spreadsheet Data.
Visualizing critical data points like digital spending, web analytics, social performance, consumer journeys, or acquisition metrics in one tool aids marketing teams in making informed decisions when it comes to campaign performance. Data can be set on a live connection or a scheduled extract to suit the company’s marketing analytics needs. Tableau is set up to support marketing teams in making quick, accurate decisions for campaign and program optimization across a host of data sources.
Enabling Holistic Marketing Analysis
Tableau supports the ability to combine data from multiple sources, but it can also be blended, providing a singular context to a particular user journey or interaction. For example, the ability to visualize customer acquisition by product from the website, compared to business goals by product. Using the visualization library and blending complex data relationships into beautiful and intuitive visualizations is seamless and can provide visuals like histograms, maps, Gantt charts, and heat maps. Now, rather than wasting time trying to comb through disparate data sources for information, efforts can be directed to curating rich insights from your data, Data-driven teams increase business user productivity by 32 percent with Tableau.
Accessibility That Fosters Collaboration
Tableau dashboards can be published to live web environments, making them accessible to multiple teams, within minutes. From desktop to mobile devices, marketing teams have easy access to their data. The online environment allows users to comment on and easily share details of each visualization, which fosters better collaboration and analysis potential regardless of where teams are located.
- Data Exploration: Tableau was created so everyone can explore their data without needing to be a data scientist, the platform can answer questions related to your data with advanced visualization tools and natural language processing.
- Drag and Drop Analytics: No more building charts and graphs from scratch, with intuitive drag-and-drop interfaces anyone can create, engage, and interact with data by building Tableau visualizations.
- Prep Builder: Self-service data preparation making it easier to combine, shape, and clean data to provide quality insights in just a few clicks.
- Data Modeling: Data is automatically enriched with business context and meaning with an at-a-glance visualization, helping to uncover relevant data to improve efficiency or customer engagement.
AI-Driven Insights
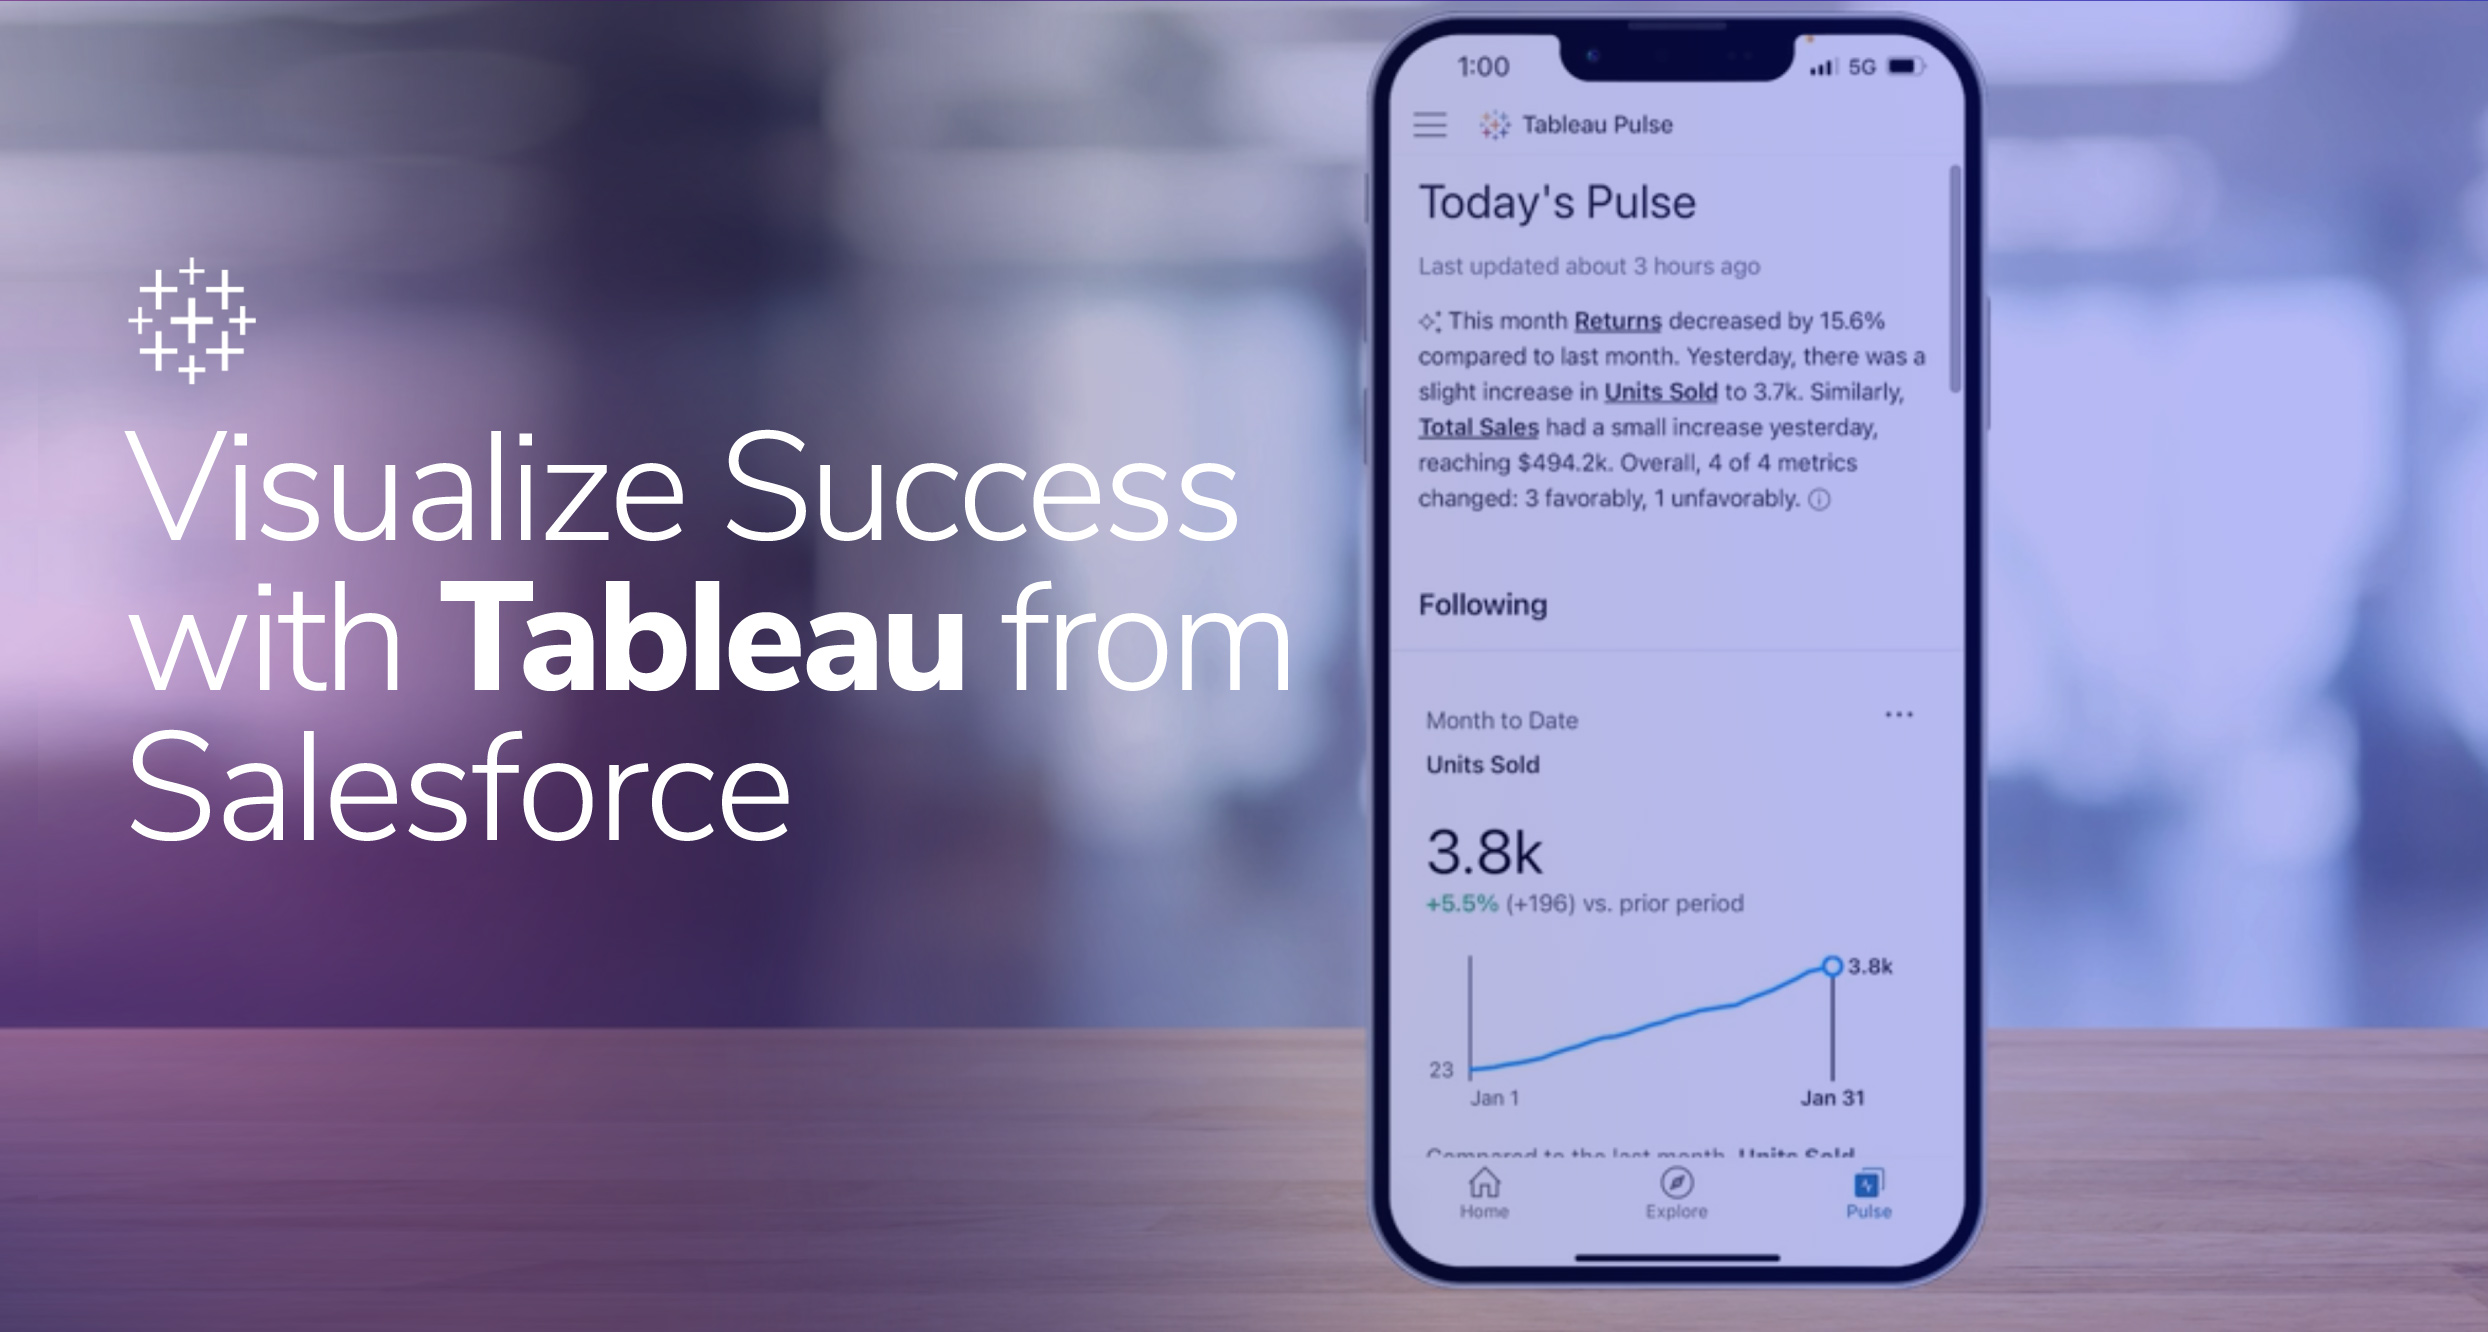
Beyond user functionality, Tableau introduced Tableau Pulse, an AI-powered insights experience that integrates data insights across multiple business tools with ease. With Tableau Pulse, teams throughout the organization can get a personalized digest of the most important insights into their respective business function, in the business tool they spend the most time in—like Salesforce, Slack, or even email.
Tableau Pulse does the heavy lifting, pulling together trends, drivers, forecasts, and outliers from your data and proactively flagging the most important information.
A statistical approach from Tableau AI powers all of this. Tableau AI is embedded into Tableau Pulse and is the next generation of AI-plus analytics capabilities. With AI, organizations can drive tangible results with the simplification of their data and insights at scale. By using generative AI, every user can get personalized and contextual insights in their flow of work with Einstein Copilot to make intelligent suggestions and maximize efficiency and fast decision-making.
AI-generated questions can help marketers answer complex questions from their data.
For example, which city is driving the best engagement from paid campaigns? How have the trends in add-to-cart engagement changed this week? In just a few clicks, teams receive real analysis, with real language. Insights can be delivered directly in the business tool you utilize most. With Tableau Pulse, you will never miss an opportunity to capture and share critical insight because you did not have time to learn a new tool or weren’t analyzing the right data at the right time.
A Trusted & Secure Data Aggregation Platform
Tableau is an 11-time Leader in the Gartner® Magic Quadrant™ helping global companies govern and safely manage their data at scale. The robust security features allow data to be integrated, shared, and accessed from a central location while enabling access to actionable insights with industry-leading security and governance models.
- Secure Data Integration: Seamlessly connect and integrate various data sources in a consolidated secure environment, facilitating easy access and analysis.
- Data Sharing and Access Control: Access control features that enable administrators to define and manage user access rights, ensuring that sensitive data is shared only with authorized personnel.
- Strict Data Governance: Enable and enforce data policies and regulations that ensure data is managed and compliant with industry standards and regulatory requirements.
- Security and Governance Models: Industry-leading security and governance models to guarantee the safety and integrity of data. This includes encryption, authentication, authorization, and auditing features to protect data from unauthorized access and ensure its integrity.
Tableau has been an integral tool for Bounteous clients to transform the way organizations visualize, engage with, and share data insights. Of course, data is only as good as the analyst and platform that interprets it. Using Tableau reporting and advanced Business Intelligence insights, Bounteous x Accolite assists marketing leaders from a variety of business sectors in curating marketing reporting that fuels confident strategies. Bounteous x Accolite Business Intelligence, with Tableau, makes telling data-driven stories easier, and better than ever.