The New Google Analytics: Ready For Enterprise
Today, Google Analytics announced so many changes at the eMetrics Summit that my head spun. True, I knew about them all and had played with all but one, but didn’t know we were announcing them *all.*
Here’s the run down, then we’ll slowly start to review them over the next few days. I’ll focus today mostly on the first one, Custom Reports, and just mention the others.
“Custom reports enable customers to create their own reports with the metrics they want to compare—organized in the way they want to see it. ” OK, that’s the Googlespeak. But to me, custom reports enable me to finally create a report once, in GA, and not have to recreate it every time I want it, and I can use the report across all the profiles that I have access to.
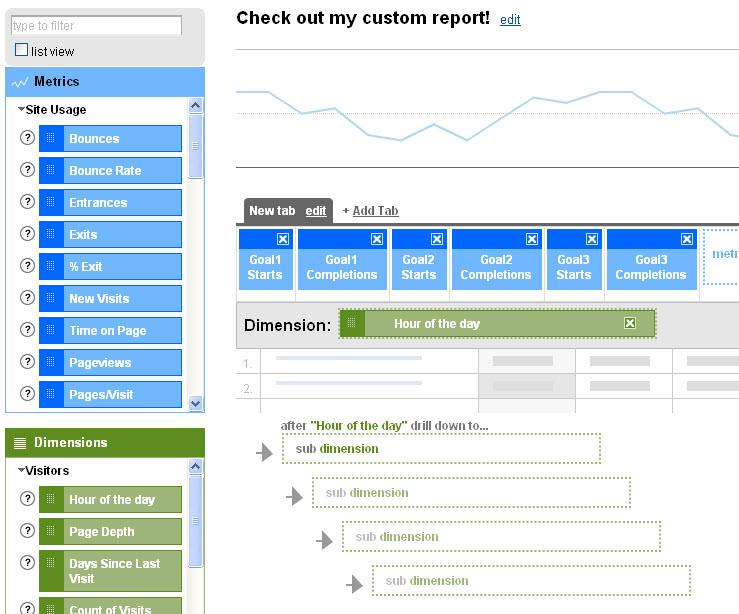
I didn’t succeed, after all this time, in creating a custom report that would blow your mind away. They all look very tame once they are created. It’s the capability that is so cool, so I thought I would show you the interface:
You have to play with it a little until you really see how powerful it is. It enables you to create what looks like a standard report, but instead of bounce rate, exits, etc across the top, you can have Goal 1 started and Goal 1 completed, or Visits with Search and Search Refinements (like in my screen shot here. ) Furthermore, you can segment by anything you want. In my screen shot, I segmented by hour of the day, but I could have chosen anything else in the green “dimension” values that you see on the left side of my screenshot.
OK, enough on this one. Let me go through the others quickly:
Advanced segmentation allows users to segment without creating all those profiles! Before this, if you wanted to see, for example, just your pay per click visitors, or just your visitors who came from Wikipedia (or whatever), you had to create separate profiles for each of those segments and filters to make them work. Now, you can just use the out-of-the-box segments like “Visits with Conversions” or create your own. (I realized this last part when I went into our account and found one called “John’s segment.”)
We’re getting an API!!! It is in private beta. This new application programming interface lets people export their data for lots of cool uses, like building custom dashboards. We won’t have to do all our work in Excel anymore.

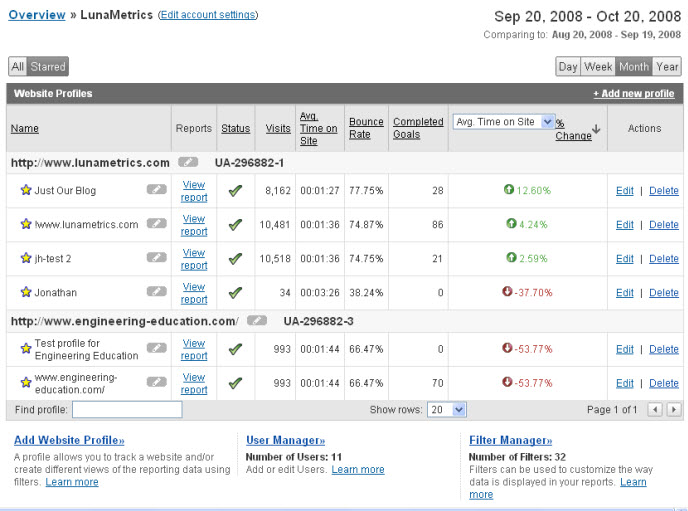
The updated interface (OK, here is a screenshot) is cleaner, and more to the point, enables users to compare their profiles and their sites. Notice here how we have some LunaMetrics profiles and some engineering-education.com profiles, both of which are in the LunaMetrics account (from back in the days when you had a hard time getting more than one Google Analytics account.) While I’m not that interested in comparing those two sites, we did training on Monday with 45 companies who run websites for academic journals, and they all asked, “I have multiple journals. How can I compare the metrics from my journals to each other?” This is a nice quick way (apologies to all those companies — I wasn’t allowed to tell you about this feature on Monday.)
Motion Charts are the next item. They aren’t my favorite yet, but I am sure they will be after you can aggregate the data by time. They are a visualization of your data — just about any data you want. You can choose up to five dimensions.
And last comes the only beta that we didn’t test at LunaMetrics — GA integration with Google AdSense. AdSense publishers will now be able to see performance by both page and referring site to make more informed decisions. Who knows? Soon maybe we will get really good integration with Website Optimizer. With Feedburner!
Damn, I won’t be creating all those profiles any more….
Robbin Steif
LunaMetrics


