Extrapolating & Segmenting (Not Provided) Keyword Data [TOOL]
The percentage growth of referrals from keyword (not provided) has left us with little choice but to improvise when it comes to segmenting branded & non-branded traffic. Non-branded traffic is a valuable metric, but when as much as 50% of organic traffic is attributed to (not provided), traditional segmentation doesn’t quite quantify things like it used to. Percentages are great, but they aren’t entirely tangible. A countable number – visitors reaching your site via non-branded keywords, for instance – is preferable; not just for you, but for your clients, as well. How do we segment a subset of organic traffic that has no real identity, though?
Well, first off, it’s going to take an assumption. For our purposes, we’ll assume that the ratio of non-branded to branded keyword referrals is independent of whether or not a user’s search is secure. In other words, the percentage of (not provided) traffic that is non-branded is equal to the percentage of provided traffic that is non-branded. This may not be entirely true, but for now, it’s a safe assumption. You can think of provided traffic as the subset of organic for which we have keyword data. So, essentially, total organic - (not provided) = provided. Simple enough, right?
Non-Branded Keyword Referrals – Monthly
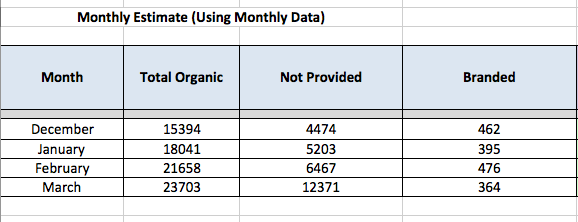
The first portion of the Excel Spreadsheet (available for download) functions to measure the ratio of non-branded to provided keyword referrals, and applies that ratio to the total organic. The reliability of this process, of course, relies heavily on the validity of the aforementioned assumption. Developing a non-linear model is beyond the scope of this post, and at this juncture, we don’t necessarily have the information to do so. Anyways, in order to use this tool, you’ll need to draw three numerical values for a given month from your analytics: total organic traffic, (not provided) keyword referrals, & branded keyword referrals. Let’s take a look at the spreadsheet.

Above, we have the inputs (whose headers are filled with the same light blue throughout the spreadsheet). We’ve entered data for the months December through March, all of which have been impacted by the (not provided) keyword referral. (Notice the month to month increase in the ‘Not Provided’ column.) We can agree that the ‘Total Organic’ and ‘Not Provided’ columns represent an accurate measure, right? But what about the integers that appear in the ‘Branded’ column? This column doesn’t represent the total branded keyword referrals, but instead, the provided branded keyword referrals. We want to extrapolate this provided data to come up with an estimation for the monthly totals. Okay, so let’s have a look at the outputs.

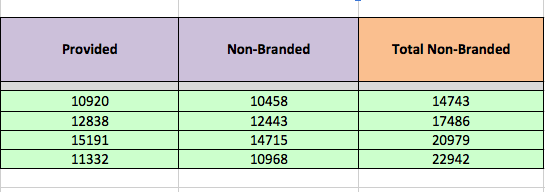
The first two columns (labeled ‘Provided’ and ‘Non-Branded’) are more for the sake of clarity than anything. As we discussed previously, provided = total organic - (not provided). From the ‘Provided’ column, we can subtract the provided branded keyword referrals (the value in the adjacent ‘Branded’ column) to get the provided non-branded keyword referrals. Alas, we have all we need to come up with our core quotient, our own Golden Ratio for estimating total monthly non-branded keyword referrals. Woo!
There are two ways that we can utilize our ratio of non-branded over provided to estimate total non-branded keyword referrals, both of which yield the same result (as one would hope). We can take the multiplicative product of the ratio and total organic traffic, or, we can apply the ratio to our (not provided) subset and add this product to the provided non-branded keyword referrals. Due to the assumed uniformity between the provided and (not provided) subsets, each of these equations holds true. And thus, we have ourselves an estimation for total non-branded keyword referrals! By no means is it exact, but it’s a quantifiable metric, nonetheless.
Projecting Monthly Totals
Another bit of functionality that I’ve included in the spreadsheet is the ability to project a monthly non-branded total given a subset of data from the present month. I won’t get into too much detail here, but essentially, what we’re doing is using the process outlined above to construct an estimate of total non-branded keyword referrals for a subset of days (the subset ranging from the first day of the month to a given day in the month – perhaps the day before you create the report). Then, we project this total to the end of the month, providing us with a monthly total. Again, there are some assumptions or axioms at the core of this process that might not consistently hold true. However, for now, assuming uniformity and making projections based on daily averages will give us a good estimate.
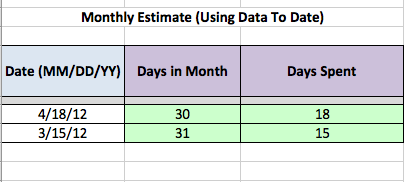
Aside from the previous inputs becoming ‘(to date)’, rather than monthly values, the only additional input that you’ll need to enter is the date of the last day in your subset. From this date, the spreadsheet will pull the number of days for which keyword data was collected (‘Days Spent’), as well as the total number of days in the month.

Using these values and our general extrapolation process, we’re able to project the total monthly non-branded keyword referrals. To provide an example of how a projection might compare to an extrapolation based on a full month’s data, we came up with estimates for the month of March using each model. We decided that, since a larger subset is more likely to be indicative of the whole, we would make our projection using keyword data from 3/1/2012 to 3/15/2012 (duly heeding the soothsayer’s warning, of course). Additionally, the mid-month point is a logical time to generate a projection report, right? Right. Let’s take a look at the resultant monthly estimate.

The bottom row showcases our estimated totals for the month of March, based on the projection of data collected within a subset of days. Take note of our estimation for total non-branded keyword referrals – 22,774. Hm, so how close is this value to the estimate we constructed using March’s full-month data? Well, if you scroll up a bit, and look at the fourth row of our previous outputs, you’ll see that we estimated total non-branded keyword referrals to be 22,942. Pretty close, right? Only 168 visitors off, to be exact. Not bad for a projection! Now, obviously, the projections won’t always match the full-month estimates. However, they can get us close.
Estimating non-branded traffic is just one of the many battles that we face in the war against (not provided). If you think that either of these tables might be useful in helping you to decipher the ever-increasing (not provided) keyword referrals, feel free to download the Excel Spreadsheet. Edit it as you please, and let us know if you come up with anything cool!


