Attribution Modeling Without Google Analytics Premium
Until recently, most analysts were giving all the credit for a conversion to the last interaction – because we had no other way to do it. In the picture below, Organic Search would get all the credit for the conversion, yet the visitor used Paid Search to find our site:

Now, with Google Analytics Premium, we have the ability to credit different and/or multiple interactions for conversions. In the example above, paid search could get all the credit with a First Interaction model, or split the credit with the last medium (organic), and there are other models to choose from. But, if you don’t have Google Analytics Premium, how do you even approach this problem?
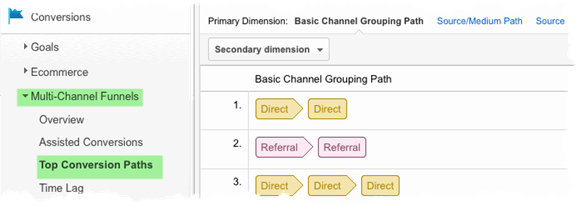
The short version of that question is: Go to your MultiChannel Funnels > Top conversion paths. Be sure that you are choosing the conversion that matters to you the most. Then, export all the paths where the conversion has a value greater than zero. Open up the file in Excel or a Google Docs Spreadsheet, and use all your spreadsheet tools to allocate the conversion value. Here, let me walk you through all the Excel work, with some tips and tricks.

Above: Choose Multi-Channel Funnels > Top conversion Paths.

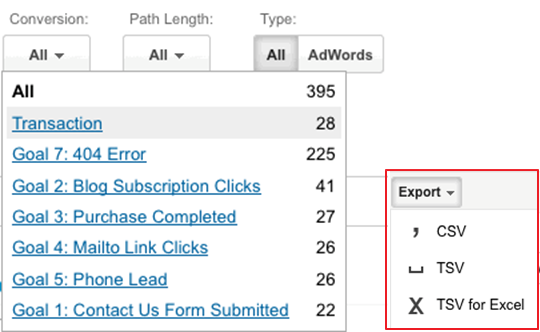
Be sure (above) to choose the conversion you care about for this analysis. Export into a format that will enable you to drop your data into a spreadsheet.
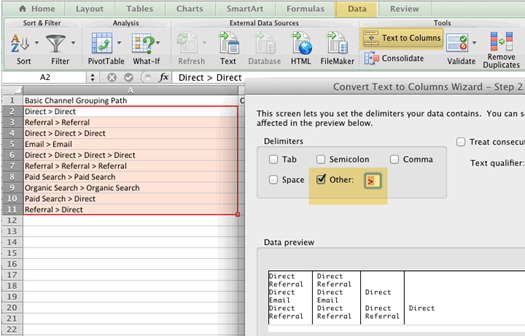
Remember that you are going to need each interaction to be in its own cell. I exported into .csv, opened with Excel, used “Data > Text to Columns” and chose the > sign as my delimiter, so that I could format as described above. That left me with a lot of white spaces that messed up my data, so a simple search and replace removed the blanks and enabled me to continue.
Below, you can see a screenshot that shows you how I got each interaction into its own spreadsheet cell. Note the yellow highlighting, so that you’ll know how to find this screen.

Important Tip: Once you do the delimiter work above, you will have created a range of cells that include all the different interactions that participated in the conversion. If you only had the four touches in the graphic at the top of this blogpost, your range would look like this:

You might be tempted to think that your range would be A1:D1. However, in all the spreadsheet work we’ll be doing here, remember that your range has to extend as far as the conversion with the largest number of interactions. So if one conversion (your “longest”) has ten interactions, your range would be A through J.
Now for the fun part. (Note: you spreadsheet experts will be able to find faster and more elegant ways to do this; please add them in the comments.)
Model I: First Interaction

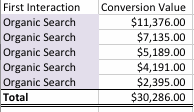
If you want to give all the credit to the first interactions, you merely sort your spreadsheet by the first row, and add up the value of all the conversions associate with each channel. In the example above, I added together all the conversion values that had “Organic Search” as the first interactions, and ditto for Email, Direct, Paid Search, etc. Each sum became the conversion value for each kind of interaction. You can see the results for organic in my small screenshot here.
Remember, you can also get First Interaction right out of the Google Analytics Multi-channel Interface, by going to the Multi-Channel Funnels, choosing Assisted Conversions, and then choosing First Interaction Analysis. But I chose to do it this way because I needed to do the setup, and because it ended up being easier when comparing with the other models.
Model II: Linear (i.e. Average)
If you want to average the credit out between all the channels that participated in the conversion, the spreadsheet work is somewhat more challenging.
- Figure out if each channel participated in each conversion, and how many times. (You can use a formula like this: =COUNTIF(Range,”Direct”) – that will show you how many times “Direct” was in the mix for each conversion. Change this formula for each channel you are working with, such as “Organic Search,” etc.)
- Then prorate the conversion value over the channels, taking into account that some channels may get more credit, because they were in the conversion path more often. In the example in the graph all the way above, we saw paid search used once, so it would get ¼ of the conversion. Organic played a part three times, so it gets the other ¾ of the conversion value. You can use a formula like this: =ConversionValue/COUNTA(Range)*HowManyTouches. Remember to replace ConversionValue with the cell that has your conversion value. Replace (Range) with the range all the interactions are in, and replace HowManyTouches with the cell where you stored the data from #1 in.
- Then add up all the values for each kind of channel.
- Here’s a screen shot that includes two rows (two conversions), each of which has only two interactions. I set up the table to see the interactions in one column (that was the #1 above) and allocated the values in the second column. Not shown: Adding up all the values for each kind of interaction.

Model III: First and Last Touch
This is a customization of what GA Premium calls “position based.” I included it because it shows you how you can customize for your own needs (and because it is interesting to me). Here, you divide the credit between the introducer and the closer, i.e. between the first and last interaction:
- Give half the credit for the conversion to the first channel, in the same way that you were easily able to give the totals to the first channel in Model I.
- Figure out which one is your last interaction. This is much harder than it sounds, because some conversions took one or two interactions to happen, and others required many more. You can use a formula like this: =INDEX(Range,MATCH(REPT(“z”,255),Range)) – just remember to replace Range, in both places, with your range.
- Allocate the other half of the value to the last interaction.
- Add everything up (not shown below)
- Here’s a screen shot where I show three conversions. The first one has three interactions and the next two only have two. By using the function I outlined in #2 above, I am able to figure out what the last interaction is (see the red balloon, below.)

What about the other models?
How about time decay? What about other customizations? Well, now you have the tools to create any kind of model you want, but full disclosure: it’s a lot of work. Creating this post sure did make me see the value in pushing a button and getting the data.
Robbin spoke about this topic in her presentation ‘Credit Where Credit is Due’ at Internet Week New York on May 14th, 2012
Updated March 29, 2015


