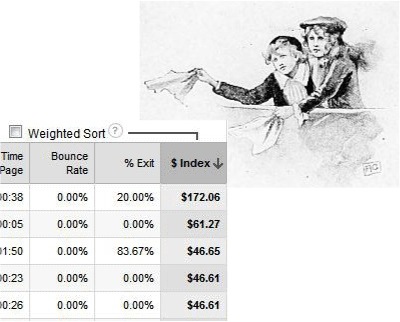
Build Weighted Sort For GA Page Value
A while back, analytics aficionados hailed the return of Google Analytics Page Value, formerly known as $ Index, one of the fastest ways to figure out which pages get more visitors to convert.

But one thing still missing was the ability to use weighted sort with this metric, which vanished completely along with the old version 4 of GA.
Instead of waiting and hoping (possibly in vain) for the return of weighted sort for Page Value, I made a Google spreadsheet to do the same thing, or at least a reasonable facsimile.
My spreadsheet imports your data, does the calculations, and returns the weighted list already sorted. Simple.
All you have to do is enter the profile ID and there’s even a built-in lookup for that.
Of course, you can do more: change the date range, filter the data, as much or as little as you like. My spreadsheet makes these options available, with no hidden formulas the deeper you go into the tabs. But you don’t have to go there. It’s up to you.
Download it now and try it yourself. (Open and go to File > Make a copy so you can edit it.)
What’s weighted sort, you say?
Weighted sort is still available in GA, but only for metrics expressed as percentages. It allows you to sort those columns from highest to lowest (or vice-versa), while giving more weight to the rows with the most data (usually the most visits).
My spreadsheet takes concepts from the article Build Your Own Weighted Sort (GA Style) by Dr. Peter J. Meyers, and applies them to Page Value. Check out Dr. Pete’s post for more info about how weighted sort works and why you want to use it.
The reasonable facsimile part
I also use the Google Apps script Google Analytics Report Automation (magic) to pull data directly from the Core Reporting API. That saves me from having to export a large table of data from GA, and I don’t need to copy and paste a giant file into my spreadsheet.
One drawback of using the API, however, is that Page Value is not directly available. Still I get pretty good results by pulling a metric called Total Value and dividing it by Unique Pageviews. Total Value is defined as the “total value for your property (including total revenue and total goal value)”.
It looks like Total Value may apply to a page whether it appears before or after a conversion. This makes the results quite reasonable for ecommerce sites, or for any site where the most valuable conversion is likely to occur on or near the last page of a visit.
Other things to try
To get exactly the same Page Value as in Google Analytics, you could always export and copy and paste (and adjust the references for the calculation tab in the spreadsheet). I haven’t found enough difference to make it worth the extra steps.
I’ve used this type of weighted sort for clients whose Total Value consists only of transactions, or actual dollar amounts, but you could use it for other types of goal values, too. In that case you might want to set up a profile that focuses only on a specific set of goals, so you’re not muddying the data by mixing goal values you never intended to be comparable.
One final note: My spreadsheet is set up for 5,000 rows of data. If you add rows and copy the formulas into them, then you can pull up to 10,000 rows with each API query.
In fact, the magic script makes it easy to run multiple queries so you could theoretically concatenate the results into one large dataset. Theoretically. I haven’t tried it. Maybe some adventurous reader will give it a whirl?
Whatever you discover when you use the spreadsheet, let me know in the comments.


