TOOL: Easily Upload Cost Data To Google Analytics
UPDATE: Google Analytics has since updated the Cost Data import APIs, and added the ability to directly import CSV files directly in the interface. The old cost data import API used by this tool has now been deprecated.
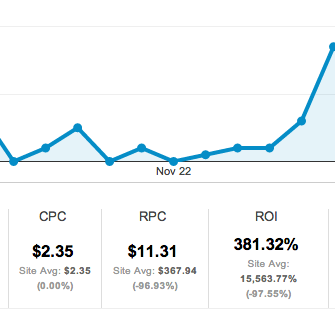
As the avid users of AdWords know, Google Analytics has a great report that pulls in cost data from AdWords. If you have an ecommerce site or currency values assigned to your goal conversions, it’ll even calculate ROI.

A while back, Google Analytics announced new support for importing cost data from other sources: think Bing Ads, Facebook advertising, etc. This is great! It puts all the power of those AdWords reports to work on your data from any kind of advertising.
The hard part is getting the data in. The data format is actually pretty easy (it’s just a CSV file). However, there’s no big “UPLOAD YOUR DATA HERE” button in Google Analytics. There’s an API for developers to import data, and a number of third-party tools that work with that API to import data from many sources. Ultimately, this is the way to go — having machines do the work on a schedule so you don’t have to. However, sometimes you just want to try things out and play with the data a bit, and if you don’t write code in Python or Java, there’s currently no easy way to do that.
Well, that is, until now. I made it just for you. Consider this your big UPLOAD YOUR DATA HERE button. UPDATE: Google Analytics has since updated the Cost Data import APIs, and added the ability to directly import CSV files directly in the interface.
Before you do this, you should follow the steps in the documentation to prepare. Briefly,
- Make sure you have campaigns tagged in Google Analytics.
- Format your cost data into a CSV file according to the specifications.
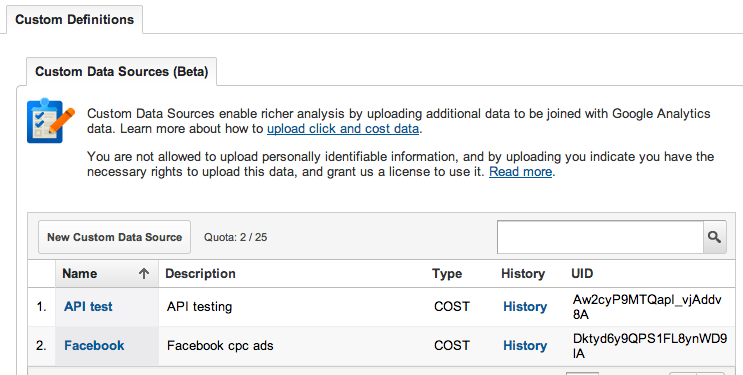
- Create a custom data source in Google Analytics in the Admin settings for your web property.

Once you’ve done all that, you can use this manual uploader page to upload the data (one day’s worth per CSV file). Enter all the information, click the button, and presto!
A few pointers:
- The Account and Web Property IDs can be found in the Admin interface in GA. The web property ID you see all over the place, and it looks something like “UA-12345-1”. The account ID is just the middle number (12345, in this case).
- The Custom Data Source ID is found in the Custom Data Sources tab of the Admin interface, and is a long alphanumeric string. You create a separate custom data source for each different type of data you’re uploading (say, one for Bing Ads data, one for Facebook data).
- The date must be in YYYY-MM-DD format.
- There are a couple of additional settings under “Advanced Settings”. Generally these are OK if you’re just making one upload for each day. However, if your data file exceeds the size limit (5MB) you might have to break it into multiple pieces, in which case you can increment the “Append” value (1 for part 1, 2 for part 2, and so on). Or, if you make a mistake, you can overwrite a previous upload by using the same Append value and setting Reset to true.
- You should see the upload appear pretty much immediately in the Admin interface. However, it may take some time for the data to be processed and appear in reports (the docs say “up to 12 hours”).
This is in very basic form right now: it doesn’t have any helpers to select from your list of accounts or web properties, and it does only very crude data validation. We’ll likely make it better over time. Feel free to leave comments if you find bugs or have suggested improvements. We’ve tested this reasonably thoroughly, but it’s free and there are no guarantees it will work for you, yada yada yada.
Note that this accesses your Google Analytics account through the OAuth protocol, which means it has access to whatever you have access to, but it connect you directly with Google Analytics. Your login, password, and data never touches our servers.
This is all made possible by the new file reader APIs in HTML5 (which your browser must support to use this), the Google Javascript API library, the authorization handlers written by Nick Mihailovski at Google used in the Hello Analytics tutorial, the letter G, and the color orange.


