How To Connect Tableau And Google Analytics

Ah, the lure of shiny objects. Tableau’s beautiful, interactive data visualizations long tempted me, but it wasn’t until they introduced the direct connection to Google Analytics that I finally took the bait. And was immediately disappointed.
It’s not that the visualizations are disappointing – my Tableau dashboards are great for interacting with GA data, and my clients are delighted with them! The letdown was in the Tableau and Google Analytics connector.
In this post, I’ll show you how the connector is supposed to work – and then show you how it can go wrong.
It’s Simple, Until It Isn’t
On the surface, connecting Tableau and Google Analytics looks straightforward and simple. You give Tableau permission to access your GA data, and then describe the data you want.
The connection process may be found in several places online, including Tableau’s own documentation, of course. I’ll recap here, for reference later when I talk about the pitfalls.
First, click “Connect to Data” and choose “Google Analytics” under More Servers… Sign in to the Google Account you use to access GA, and click “Allow” when Tableau asks for permission.
Then tell Tableau what data you want to see. Select the options presented as Steps 1, 2, and 3. See what they did there? It’s easy as 1-2-3!

Step 1: Choose an Account, Property, and Profile (View)
Step 2: Select Filters (Date Range and Segment)
Step 3: Select up to 7 Dimensions and 10 Measures
Tableau sets Date as a dimension by default, and you’ll probably want to keep it. Search the list to add another dimension. (Or more, if you’re feeling lucky. See “Common Pitfalls” below.)
Then select your GA metrics, called measures in Tableau. Choose one of the suggested “Measure Groups” or search for specific GA metrics.
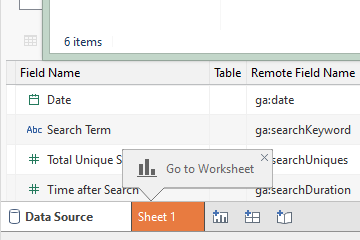
After you have selected at least one item in every dropdown list, for all 3 steps, you can tell Tableau to pull the data. In a new workbook, Tableau will helpfully highlight the Sheet 1 tab as shown here. In an existing workbook, click any sheet or click the next icon to add a new sheet.
When you go to the sheet, you’ll see the name of your data source at the top of the left navigation pane, followed by the list of dimensions and measures you requested. Plus a couple extras in italics, like Number of Records. Metadata: bonus!
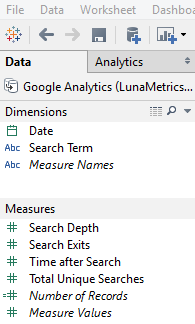
Now you’re all set to start visualizing that data, right? Maybe. Maybe not.
Common Pitfalls
About the only thing that can go wrong in Step 1 is that your GA account has poorly named properties or views, but that’s not Tableau’s fault. Go fix the names so you can tell what they are!
It’s a different story for Steps 2 and 3.
In Step 2, you have the option to “filter” your data. Tableau recognizes that it’s not a good idea to ask for ALL THE DATA – and Step 2 provides two ways to define a smaller data set.
Wait, why can’t you ask for all the data? In a word: Limits.
Pitfall #1:
The GA connector is bound by the limits of the Google Analytics API, which means you can’t ask for more than 10,000 rows of data at a time.
Pitfall #2:
If you ask for any segment of data that GA has to calculate by searching through a really large set (500,000 sessions or more), then GA will estimate total results based on a sample of that data.
The worst part is that Tableau doesn’t warn you when it returns incomplete or inaccurate, sampled data.
Pro Tip: Use the API Query Explorer! Enter the same date range, segment, dimensions, and metrics.
The Query Explorer will tell you (1) how many rows of results were available (even though it returns 10K rows max), and (2) whether or not the data was based on a sample.
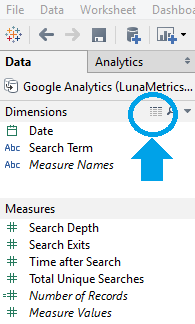
You can also download the results from the Query Explorer and view them in Excel. To see what Tableau pulled from GA, click the table icon (“View Data”) at the top of the left navigation pane, next to “Dimensions”. Select all, click “Copy” and paste into Excel to compare.
You may have noticed this doesn’t solve the problem, but only alerts you that a problem exists. Read on!
Pitfall #3:
You can’t use “filters” in the Google Analytics sense, at least not to reduce the volume of data in your request.
Sure, Tableau lets you choose segments – er, ONE segment – to reduce the size of the data set. But for GA there’s a big difference between segmenting and filtering.
In Google Analytics, you can use the search box on any table to filter what data is displayed. The act of filtering simply removes some rows from the existing table.
On the other hand, when you apply a segment, it’s like asking GA to search all the data in your property and create a brand new table. This can result in sampled data, Pitfall #2.
In Tableau, if you want to remove some rows you have to pull the data first, and then filter it. Not having this option can result in getting cut off at 10K rows, or incomplete data, Pitfall #1.
Does it feel like we’re going in circles here? One more pitfall, this time from Step 3, Selecting Dimensions and Measures.
Pitfall #4:
If you ask for too many dimensions, you may get sampled data.
Google Analytics pre-aggregates certain combinations of dimensions and metrics, to produce the default set of tables also called “standard reports”. If you ask for a combination of dimensions that was not already calculated, GA has to create a brand new table. Same as with segments!
Examples: Add Device Category to a dimension like Source/Medium. Add Page to Event Category, Action, and Label. It’s not obvious, and there’s no warning.
If you’re a Google Analytics Premium customer, see the note at the bottom for ways around this issue!
Again, use the Query Explorer to discover the problem. Maybe you’ll find there is no problem. Swell!
But if there is a problem, what are you going to do about it?
Web Data Connector to the Rescue
The newest version of Tableau introduced a feature called Web Data Connector, which you can connect to Google Sheets!
This means you can use the Google Spreadsheet Add-On for Google Analytics, build the tables you want using filters if needed, and then connect those tables to Tableau.
Using the Add-On in Google Sheets gives you another advantage. You can combine API data from multiple queries before sending it to Tableau.
This supports the most common remedy for sampled data: reducing the date range. But it also allows you to combine data from different views, properties, or even accounts.
Why Bother?
You may be wondering, “Why not just use GA for reports and analysis?” Isn’t this a lot of bother to re-create something that already works pretty well?
It’s true there are already many features in Google Analytics reports, such as secondary dimensions and charting options among others, that are great for exploring your data and producing reliable, accurate reports.
And it’s true you could produce something in Tableau that is less functional than what’s in GA.
But it’s also possible to go way beyond.
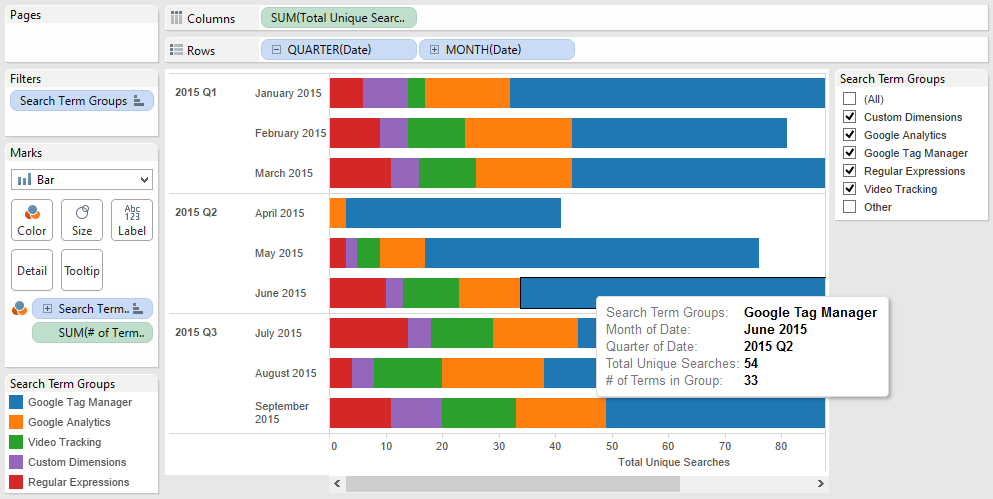
With Tableau, you can:
- add interactive features customized to your audience, e.g. list selectors
- rename and re-group dimensions and measures, and create hierarchies
- easily join data to provide context and improve readability
As long as you’re aware of the pitfalls and are prepared to address them, you’re ready to start visualizing.
Google Analytics Premium and Tableau
Just a quick note – the main takeaway here is that when Tableau requests data from Google Analytics, you’re subjected to the same sampling limits that would typically apply in the interface and the Core Reporting API. If you’re a Google Analytics Premium customer, this means there are steps you can take to overcome many of these pitfalls – mainly using Custom Tables to tell GA which reports should be unsampled.
We’ll save GA Premium and Tableau for a later post, but in the meantime you can read more about unsampled data, Custom Tables, and Google Analytics Premium.
Have you faced any pitfalls connecting Tableau and Google Analytics? How did you work around them? Have you tried the new Web Data Connector yet? Please share in the comments.


