What's Premium About Google Analytics Custom Funnels
As web analysts and marketers know, analyzing and understanding user behavior is so much more than reporting on overall users and pageviews.
There are tools in the Google Analytics interface to help understand behavior like the Navigation Summary and Entrance Paths, but both are limited in terms of the scope of steps and stages. Even the Behavior Flow report, showing a complex map of user navigation, really just scratches the surface of behavior analyses. Using the funnel visualization or sequences with advanced segments are also options, but a new feature may prove to be one of the most powerful (and easiest) tools yet!
Introducing: Custom Funnel Reports
Custom Funnel Reports is the newest available reporting feature released by Google Analytics 360. It is a custom reporting template that allows you to experiment and create funnels out of nearly any user behavior and action on your site. You don’t necessarily need an explicit stepped process with pages belonging to a strict path. In fact, using custom funnel reports becomes more valuable when you think of ways to explore the data.
The view that you are in must be within a Google Analytics 360 property. If you are not currently a GA360 customer, you will not have access to this type of report but can follow along with the screenshots! If you’ve used Enhanced Ecommerce features like Shopping Behavior and Checkout Steps, you will be familiar with the look and feel of the end report.
Creating a Custom Funnel Report
Like other custom reports, the first step is navigating to the Customization tab in the topmost menu and choosing New Custom Report. Once in the creation screen with all of the custom report settings, you should notice that there is a new button in the Type section, Funnel.
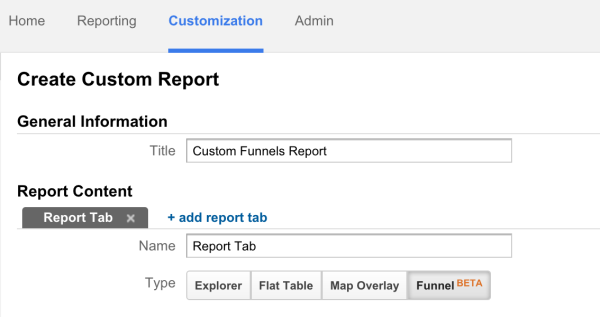
Then, you can choose what sort of analysis you are looking for. If you are more focused on sessions, choose “All stages must occur within the same session.” If you want a user-level, choose “Different stages can occur in different sessions.” This option means that if a user completes a step one day and completes the funnel the next, the user will still be counted in the funnel analysis and not look like a drop-off.
The section Funnel Rules is where the steps, or stages, are defined based on Google Analytics dimensions. You may already have some ideas for pages that you are interested in creating a funnel report for but don’t limit yourself to just pages!
The best part about these reports is that you can use any dimension in Google Analytics, including custom dimensions and ecommerce dimensions. You can even use different dimensions for different stages or different dimension conditions in the same stage as well.
This can be used to create a funnel solely from events. Maybe we have a one-page form with events that fire on the individual form fields and we want to track drop-off within that form. We wouldn’t be able to use the goal funnel visualization because it is a single URL.
Below is an example of a Custom Funnel Report based off of fields in a lead generation form. The settings for the individual steps would be based of of event category, action and label:
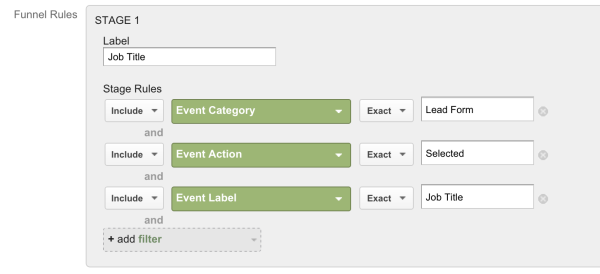
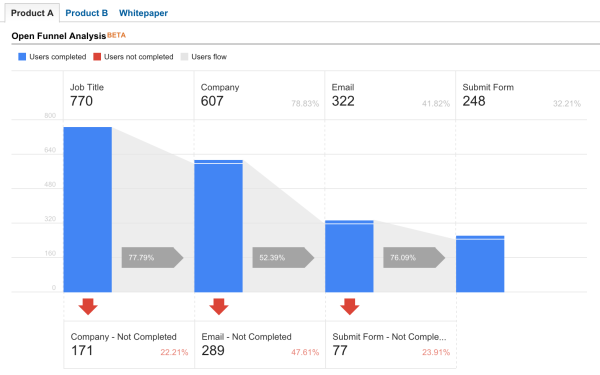
This may spark ideas about creating event-based funnels around actions that you may already have implemented like scroll tracking, video interaction or even timing events! The limits for Custom Funnel Reports are currently a maximum of 5 rules per stage and 5 stages total.
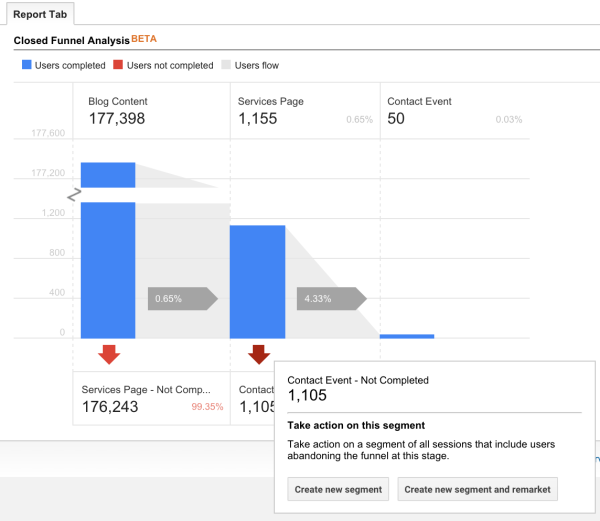
Custom Funnel Reports can also be used to analyze user actions along with content. For example, at LunaMetrics we might want to analyze the closed funnel of users who view blog content, then view our services page, and finally take action to contact us. Not only can we analyze the volume of users who flow through the stages, we can create segments based off of the stages and drop-offs. In this case, I might want to target the users who left the funnel before completing the last action of submitting a contact form to create an advanced segment or remarket to this very specific audience.
Custom Funnel Reports vs. Funnel Visualizations
Custom Funnel Reports don’t have the same behavior as the funnel visualizations and work differently. Unlike the funnel visualization report, there are no backfills, it can be used on historical data and you can add an advanced segment to the reports (there is a limit of only one at a time).
However, you do have similar options such as choosing whether the funnel is open (where a user can enter the process at any step) or closed (where a user must hit the first step to be included in the funnel). Custom funnel reports are also visually different and are interactive.
Custom Funnel Reports vs. Sequences in Advanced Segments
Custom Funnel Reports are similar to advanced segments in that you are free to use any and multiple Google Analytics dimensions. Both also provide the option of specifying whether the next step should be immediately following the previous step or not.
The biggest difference between these two tools is that Custom Funnel Reports allow you to interact with and re-engage your users based off of where they entered or dropped out of the funnel with remarketing. Also, keep in mind that using any type of advanced segments in the standard version of Google Analytics will trigger sampling if there are more than 500,000 sessions in the range of the report and flow visualizations will trigger sampling at 100,000.
The GA360 Custom Funnel Reports provide a new way to analyze behavior with Google Analytics. Moving toward user-centric analysis, the flexibility lets us analysts and marketers think more about the journey and story of people using the site in a more focused and insightful way.


