Why Is My Google Analytics Bounce Rate So High?

Bounce Rate, discussed, debated, debunked – take your pick! If you’re reading this, you’re probably staring at your Google Analytics Audience Overview, excited about the shiny numbers, and starting to wonder just what it all means. Or perhaps, you’ve been using Google Analytics for years, but never really understood this particular metric.
So here we go – let’s cover the basics, reiterate the definitions, and calm the nerves.
1. Bounce Rate is a Measurement
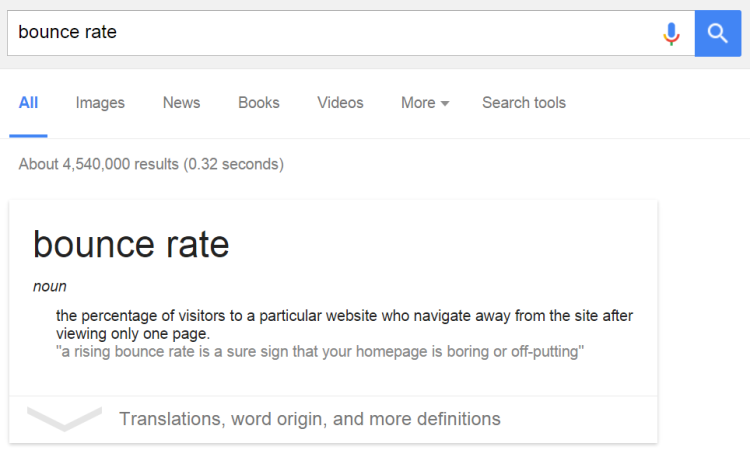
Trying googling “bounce rate” and you’ll get almost 5 MILLION results, as well as a handy definition. Whoa, information overload.

Like most metrics in Google Analytics, Bounce Rate is a measurement. Where pageviews is a simple count of how many pages were viewed, Bounce Rate is actually a calculation. Let’s look at Google Analytics’s definition.
Bounce Rate is the percentage of single-page sessions (i.e. sessions in which the person left your site from the entrance page without interacting with the page).
How do we feel about that definition? Well, I’ll give it a B. It’s close to accurate, and understandably, it’s somewhat simplifying the concept. The parenthetical gets at the heart of it in a little more detail.
Bounce Rate is trying to measure the number of people that arrive on your site, hit a page, and then leave.
To make that definition more accurate, we just have to change one word. Let’s try this.
Bounce Rate is the percentage of single-INTERACTION sessions (i.e. sessions in which the person left your site from the entrance page without interacting with the page).
There. Much better.
2. Interactions Affect Bounce Rate
With the most simple, default implementation of Google Analytics, we’re only tracking pageviews. However, there are other things that can be tracked – like Events and Virtual Pageviews. This will also affect your Bounce Rate, as they’re indications of a second interaction.
Often, we use Events to track user-initiated actions on the page, like scrolling, video plays, form fields, or downloads. Unless specifically configured not to count as an interaction, these will all affect your Bounce Rate. Which, sometimes is ok!
3. Bounce Rate is Personal To You.
Here is a very important takeaway. (In fact, I use it twice in this article!) YOU get to decide whether Events on your website count as interactions or not, and so you have the power to decide what should be bounce and what should not be a bounce.
At the heart of Bounce Rate is a perceived negative experience. What we’re trying to quantify with Bounce Rate is the following: Someone arrives at your site and doesn’t do _________. By default, that negative action is that they didn’t visit a second page. You get to decide if that should be different.
Remember that the Bounce Rate measurement inside of Google Analytics is not affecting your search engine rankings in anyway. This is a number that is meant for you and your analysis.
3. Changing Behavior vs Measurement
There are lots and lots of articles out there about decreasing your Bounce Rate. We’ve written a couple! Keep in mind point #1 – Bounce Rate is a measurement. Most articles you read about decreasing Bounce Rate are actually talking about changing what is tracked, or more importantly, changing the definition of Bounce Rate. This is much different than changing the behavior of the people coming to your site.
So instead of saying:
“A bounce is when someone arrives at my site and only visits a single page.”
We can make it say something along the lines of:
“A bounce is when someone arrives at my site and only visits a single page and spends less than 1 minute there.”
Or something more complicated like:
“A bounce is when someone arrives at my site and only visits a single page and does not fill out the form on the page.”
By adding interaction Events, we’re moving people from the Bounce category (single interaction) to the engaged users category (multiple interactions).
We haven’t changed how users interact with our site, people aren’t necessarily staying longer or diving deeper, we’re just clarifying what we consider to be a Bounce, which is still a valuable exercise.
A lot of blogs will call this an “adjusted bounce rate” or something similar, which makes sense. We’re taking the default definition of bounce rate and changing it!
4. The More Specific, the Better
Let’s think about when Bounce Rate is important to use for analysis. Since the Audience Overview is the default report, it’s one of the first things that people see when they log into Google Analytics.
This particular measurement is showing us the site-wide Bounce Rate. Is that… helpful?
Sometimes it might be! Most often, it won’t be. Take a good look at the content on your site. Does it all fit into the same category? Our website is a content website, a lead gen website, a services website, an ecommerce website – you name it! Clearly user behavior is going to be different on each section of the site, so averaging all of it together into a single number doesn’t really tell us much.
Rather – try looking at Bounce Rate in granular reports. Use Advanced Segments to narrow your website to a specific category of pages, and see how they’re performing vs other sections.
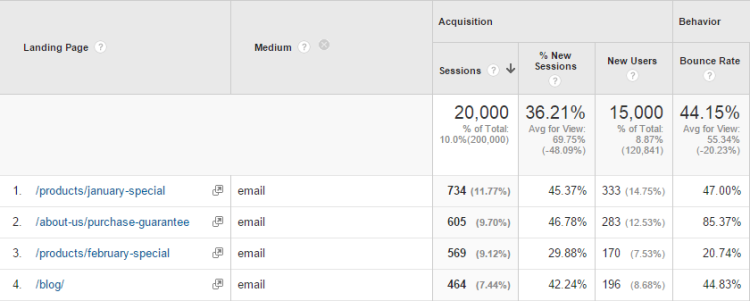
Take a look at your Landing Pages report and look at the Bounce Rate on specific pages. If you have 5 landing pages that you’re sending traffic to, and if your goal is to get them to visit another page, then focus on the one with the worst Bounce Rate! (Hint: Try using the Weighted Sort for this report!)

Take a look at your Channels report or your Campaigns report. If you’re sending traffic to your site, which ones are getting users to stay longer or indicate that they’re engaged in some way.
5. Ok, But What is a Good Bounce Rate?
Alright, I’ve put it off long enough. Sometimes you can talk someone’s ear off and they’ll still badger you. “I hear you Jon, measurement, reporting, yada yada – just tell me if my site is doing ok!”
Unfortunately, it’s not that easy.
Bounce Rate is Personal To You
Let’s think about your site and your content again. What is the goal of your website? Do you have a website that encourages people to come on in, look around, spend some time here? Think about sites like Facebook or Amazon where you lose hours of your life.

Or instead, does your site encourage single-serving sessions? Visitors to blogs and content sites typically will come in, read the article they were looking for, and get the heck out. Think about scrolling through your Facbeook feed and seeing an interesting looking article. You click, you read, you hit back. Rinse and repeat. Technically, in the default setup, you’d be considered a bounce even though you got exactly what you wanted.
In our age of search engines delivering people to the exact page they were looking for, we tend to spend less time “exploring” a site and more time crafting our search queries.
I’ve been guilty of telling people, “Just Google ‘Bounteous filter internal traffic'” rather than taking the time to explain our navigation bar, site hierarchy, or where our internal search bar is located.
Think about the actual user experience and if users have any need or motivation to visit more than one page. And if not, think about other ways you can measure engagement rather than relying on a second page visit.
6. That Wasn’t an Answer…
Ok – let’s talk about some actual numbers.
Here’s a popular table that I’ve seen around the internet before… I won’t say where I found it, but I’ll tell you that I don’t like it.
50% or less is excellent
60-70% is typical
70-80% is poor
80%+ is very bad
I’d advise against listening to anything like this. Ignore it. Too general. Not to mention that it somehow missed the entire 50-60% range and overlapped ranges.
50% or less could be ok
51-60% might be alright
61-70% seems reasonable
71-80% happens all the time
81%+ is a completely normal
7. A Better Way to Compare
Rather than focusing on you vs everyone else, you need to focus on you vs you. Compare your numbers to yourself last month, last year. Are things going up or down? Focus more on how your site is trending or hone in on specific segments that appear to be doing worse than others.
If you do want to compare against others, try to narrow in on others in your industry. Google Analytics offers Benchmarking reports, which you can use to specify your industry and size, and see what they think a normal bounce rate might be by Channels, Device, or Location.

Keep your eye on the number of web properties that contribute to your reports. I’ve seen that number get really low, which would make it more prone to being thrown off by outliers! Consider that you have on idea how others have defined their bounce rate, so it’s hard for you to compare. They may be using the default Google Analytics version, or they may have implemented Events and thrown everything off.
7. A Note Of Caution
I will give you one actual number though – if your bounce rate is below 10% or possibly below 5%, then it’s wrong. Or at least, it’s wrong in the sense that it’s not recording what you think it’s recording. You’ve changed the definition of a bounce in a way that it’s included too many people. Now this number is mostly useless to you! How will you compare across segments if you’ve made it so easy that anyone is classified as engaged?
I would call this a huge red flag and you should look into it immediately. It’s most likely due to firing multiple pageviews on the same page or firing an interaction event as soon as the page loads.
8. Final Thoughts
So that’s it! There’s no magic number you have to hit, you aren’t being judged by the Google Analytics overlords for your poor performing site. Remember to make it personal to you and to make sure you understand how it’s being tracked. Compare against yourself and make educated decisions if you decide to alter the way you measure engagement on your site. Once you agree on the measurement, then start tackling the user experience. Focus on pages that perform poorly and cut out traffic segments that seem disinterested.