Google Analytics and Google Tag Manager Debugging Tools

Are you trying to implement a new marketing pixel via Google Tag Manager (GTM) but aren’t seeing data in your DSP? Have pageviews stopped sending to Google Analytics (GA)? What’s going on?! No matter what the challenge may be, don’t rage quit on your GA/GTM implementation!
Believe me, I know there are a lot of moving parts and processes to keep track of but stay strong. At Bounteous, there are many different tools we use to help make our jobs easier. Since much of GA/GTM happens within the web browser, we utilize a variety of built-in browser tools and Google Chrome Extensions. These tools enhance visibility into the mechanics of the inner workings of GA/GTM and help with configuring, implementing, and debugging.
So let’s peer behind the curtain and take a look…
The Basics: JavaScript Console
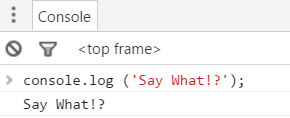
I would be remiss if I didn't first mention the JavaScript Console that can be found within Google Chrome and most other browsers. The console allows you to test JavaScript within the browser on any website. When configuring custom scripts within GTM, you can use ‘console.log’ within your code to aid in your troubleshooting. The console also allows you to access the dataLayer and objects found within your code to ensure the data is found in its proper place.
Some of the other tools mentioned below make use of the JavaScript Console to print debug information, stay tuned!
You’ll find the Console as part of the Web Developer Tools, listed in the Chrome menu under More Tools > Developer Tools. Developer Tools can be accessed via keyboard shortcuts as well:
- Windows: OS: F12 or CTRL + SHIFT + J
- Mac OS: CMD + OPT + J
Google Tag Manager Preview Mode
Prior to publishing your tags in GTM, enabling Preview Mode gives you access to the mechanics of your tags, triggers, and variables. Only you can see Preview Mode, as it only is enabled based on a special cookie set within your browser. The left pane shows you the events through the page loading process and the right pane shows you how the tags, variables, and dataLayer were affected through each step. This is a great tool for confirming your configuration.
Google Analytics Debugger
While it is true that you can access GA’s debug mode without any extension, Google’s own debugger extension makes this a simple, painless process. Once enabled, it decodes all of the hits sent to GA and prints them to the console. This is a great tool for checking for broken sessions and verifying custom dimensions!
Is it not working for you? Refresh the page or try turning it off and back on by clicking on the extension icon while you have the console open.
Google Tag Assistant
The Tag Assistant Chrome extension is a very useful tool in testing and debugging your implementation. It does almost everything you would expect. First, it displays and troubleshoots the status of most Google-related tags – be it Analytics, Google Ads, Campaign Manager, or Tag Manager. Within the tool, you can even enable GA debugging mode.
One of the most powerful features within the tool is Tag Assistant recordings. This allows you to “record” a browsing session and produce a report on all of the hits being sent through and even how they will potentially show up within Google Analytics. Tag Assistant has been known to be buggy at times, but things seemed to have stabilized in recent months.
Dataslayer
Dataslayer is another great extension that similarly allows you to debug your analytics and tag management implementation. There is added versatility with the fact that it is compatible with reading Adobe Analytics, Adobe Launch, and Tealium data layers, as well as Google Tag Manager.
Omnibug
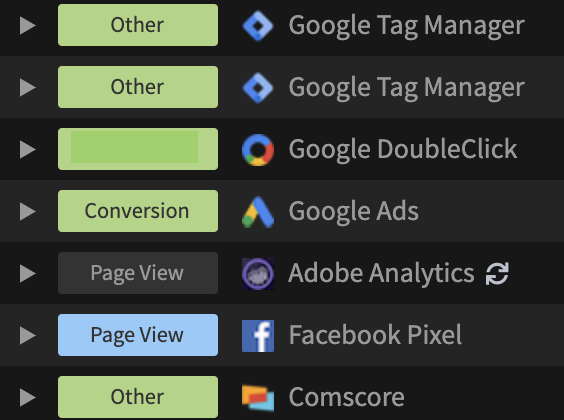
Omnibug has quickly become one of our favorite debugging extensions for a few reasons. Foremost among those reasons is that it is compatible with all major tag managers, analytics platforms, and marketing pixels. Secondly — the user interface (UI) is very clean and intuitive to use; collapsing the contents to be made available when you want it.
Don’t have time to look at all of this data now? You can view the output of your Omnibug session in a new tab or have it exported as a CSV. It’s definitely a tool to try out no matter what platform you’re using or what needs to be debugged in your implementation.
GTM/GA Debug
GTM/GA Debug is a newer debugging extension that has some unique features that can be vital to an organized, stress-free debugging session. Sort and filter the real-time GA hits by hit type or property ID if you’re sending data to multiple properties — this really cleans things up in your interface! And for those users who’ve implemented Enhanced Ecommerce (EE) on their site, there is even a separate EE tab that can report on Promotions, Impressions, Checkout Steps, and other EE metrics from each page; highly recommended!
Injector
Injector is a tool that allows you to insert CSS or JavaScript code snippets client-side as the webpage loads. From an analytics perspective, this is a useful tool for testing future work to be done in GTM where there currently is no container installed or you don’t have access to the on-page container.
Tag Manager Injector
Similar to Injector, Tag Manager Injector simplifies the process of inserting GTM code on a site on the fly where no code currently exists. This is useful should you want to quickly test GTM without altering the code on the site. You can even push variables to the dataLayer to test other aspects of your implementation. This extension is now available for $3.99/year.
EditThisCookie
EditThisCookie has long-proven itself to be an indispensable tool around our collaboration centers. When enabled, you can view cookies set by Google Analytics, delete cookies, modify cookies, and even add additional cookies. This is a great tool for verifying GA trackers and any other custom cookies that may be in use.
Working with subdomains or implementing cross-domain tracking? This tool is a must-have!
SelectorGadget
Sometimes, when creating tags we need to create a trigger that is based on a specific button click or just a few button clicks on a site. One way to quickly accomplish this is by using the SelectorGadget Chrome extension. Its intuitive interface allows you to point and click on desired elements of the site and deselect elements you don’t want to capture; giving you the appropriate CSS selector string that you can use in your GTM click trigger like the one below
Code Editor for GTM
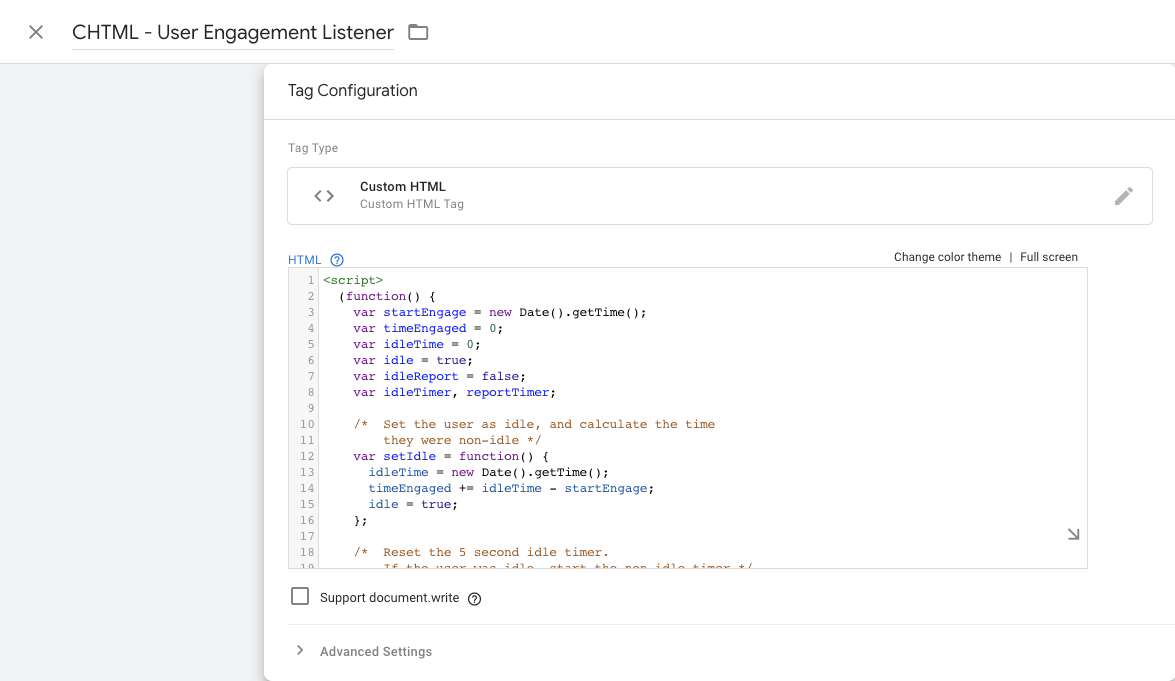
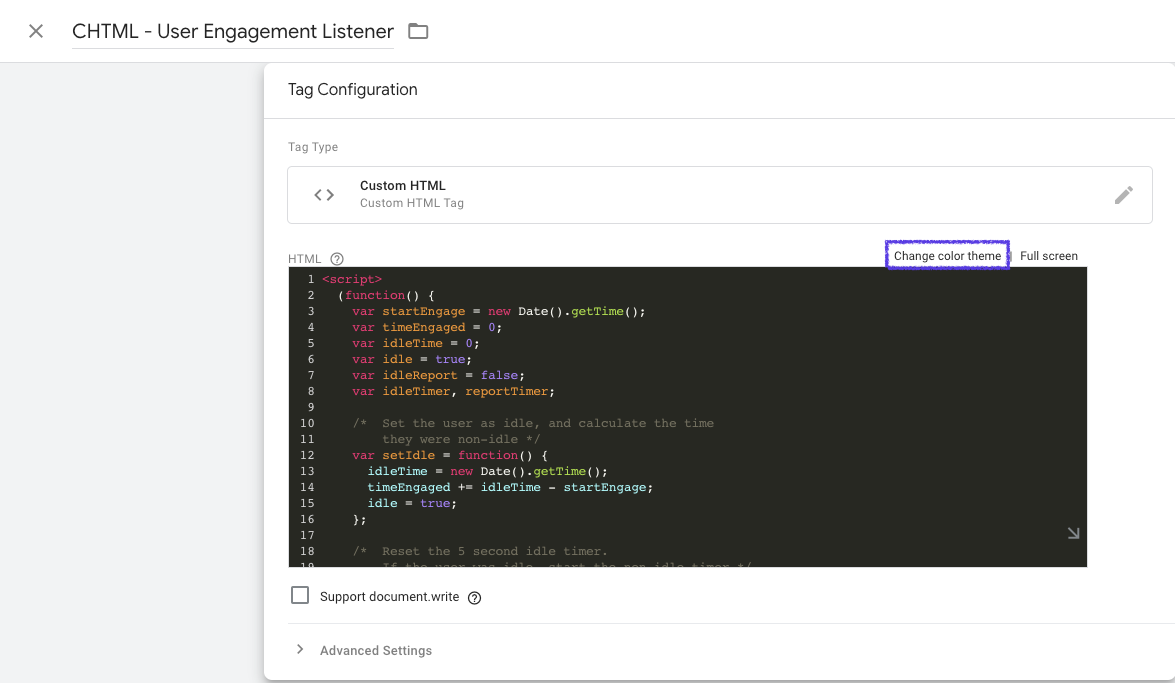
While GTM has improved its code syntax highlighting since its inception, many still favor the styling of this Code Editor Chrome extension. While not necessarily a debugging tool, making code within GTM easier to read certainly aids the overall process. Take a look at the difference in CHTML tag below:
Without Code Editor:
With Code Editor:
Just Scratching the Surface
These are some of the main debugging tools we use right now. While this list is purely a snapshot in time, newer tools will likely be discovered and find their way into our use. As they do, we will be sure to let you know what tools make our collective debugging lives easier.


