Naming Events And Traffic Sources For Easier Reporting In Google Analytics

Editor's note: If you've made the switch to Google Analytics 4 Properties please see, Event Naming Considerations for Google Analytics 4 Properties, to determine the event naming convention most fitting for your needs.
This blog post describes how to name Events and Traffic Sources in order to take maximum advantage of the default Event and Acquisition reports in the Google Analytics interface. Some features of the interface, like drill-downs, assume your data has a certain structure to it. You will get the most value out of your reporting if you make sure your data adheres to that structure.
If you use more advanced reporting tools, like Custom Reports or the Core Reporting API, then you have more leeway to structure your data differently. Even so, there are still benefits to organizing your data in the ways described below. If you follow the advice in this blog post, it should help make your report filters straightforward and easy to maintain, and keep you from having to aggregate multiple data pulls into one.
The Importance of Consistency
The most important step of any naming convention is ensuring consistency across your implementation. No schema or taxonomy will save you if your data is inconsistent. If links to external sites are called “Outbound Links” on your site, then that is the only name that you should ever use. Some Events use the name “Outbound links” or “Outbound Link” or “Outbound Link Clicks,” then Google Analytics will think it seeing a completely different Event, and your data won’t aggregate properly. Heaven help you if you if one link is tagged “Outbound Links ” (hint: spaces are characters too).

Event Naming
Naming conventions allow you to do two things in your reporting: aggregate some Events together into a single report, and separate some Events from each other. A naming convention can do both at once, such as when Download clicks for two different files are aggregated, but separated from clicks on Contact links.
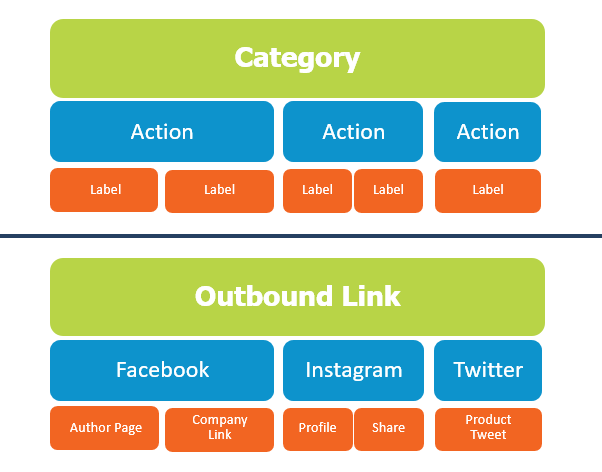
Events are aggregated and separated by using the built-in Event Dimensions: Category, Action, or Label. Events with one or more of those dimensions in common are aggregated in the built-in Event reports; Events that differ in one or more of these dimensions are easily separated.
Event reporting is not limited to the built-in Event Dimensions. You can also use any number of hit-level Custom Dimensions to aggregate and separate your Events. However, the built-in dimensions are more convenient because there are reports for them built into the web interface already, which are not sampled. Using Custom Dimensions with Events may result in sampling. (Note: The built-in Event reports are sampled right now, but Google has acknowledged this as a bug and is working to fix it.)
Combining and Comparing
Aggregating and separating Events allows you to combine Events into a single line-item in one report, or compare the totals for two Events side-by-side in a single report. The naming conventions that you choose for your Events should be based around what you want to compare, and which Events you want to roll up into a combined total.
Google Analytics assumes that combining and comparing go together, so that if you want to compare two Events for one report, then you must also want to combine those Events for another report. The Event Dimensions used to create a hierarchy, with Category as the most-combined dimension, Action being slightly more specific (separated) than Category, and Label being the most-specific description of an Event.

Naming
If you would commonly want to include two different Events in the same report, either combining them into a total or comparing them against each other, then those two Events should have the same Category. Otherwise, Events should have different Categories. For example, if you want to compare the number of clicks on email addresses to clicks on telephone numbers, you should combine them under the same Category, such as “Contact.”
Two Events in the same Category may have different Actions if they are meant to be compared to each other, but they should have the same Action if they are meant to be combined together when comparing against other aggregates. In the above example for contact links, email links should all have an Action of “Email” and telephone links should all have an Action of “Telephone”. Actions should be at the same level of granularity; having all email addresses tallied together and compared against individual telephone numbers is not a very readable or useful report.
The Event Label should be the most specific identifier for an Event. For our example of Contact Links, it should be the email address or telephone number that the user is clicking on. The Label dimension is not required in Google Analytics, but it is a best practice to try and use a value that makes sense.
If you can think of any way that you might want to break down your data, put that value into the Label dimension. As a backup, you can put Page Path into the Label so you can see where the Event is happening on your site (this is merely a convenience because the Page dimension is tracked automatically for all Events).
Reporting
If your Events form a hierarchy, then the Events report for your site will actually form a hierarchy of reports, achieved by the drill-down function in Google Analytics. The Top Events report shows a list of all the Categories on your site; when each Category is clicked, you can view a report on the Actions under that Category. Each of those Actions, in turn, links to a report of the Labels. If two Events are combined in the Action-level report, those same Events are compared in the Label-level report. If the Events on your site fit into a hierarchy, then each of these reports is useful on its own, and these reports together will cover almost all of your Event reporting needs.

Drill-down reporting is where naming consistency becomes very important. If Email links are sometimes tracked with an Action of “Email” and sometimes “Email Link,” then your list of email addresses will be spread across two different reports. Finding the most popular email addresses will require running both reports and merging them, or stepping outside of the default reporting in order to build a complicated filter. This extra work can be avoided by making sure your names are consistent!
A report with only one item in it is not a very useful report! Just because the middle Event Dimension is named “Action” doesn’t mean that it needs to represent an Action. Most actions that a user takes on a website are clicking on something. Because of this, an Action of “Click” doesn’t separate one Event from another, so the Action report doesn’t let you compare anything. You have the opportunity to use Categories, Actions, and Labels so that your Events provide value data that you can use for actionable insight!

Campaign Tagging
The names of some traffic sources cannot be changed. Direct traffic, organic search, and referrals from sites you don’t control are all given default values for their Traffic Dimensions in Google Analytics. However, you get to control the naming conventions of Campaign traffic, and any other traffic where you can control the URL that the user visits.
Google provides the URL Builder Tool for constructing URLs that will populate the Traffic Dimensions in Google Analytics: Source, Medium, and Campaign. The Channel report is also based off of the values in these Dimensions, and Paid Search campaigns can make use of the optional Keyword and Content dimensions.
Medium and Source

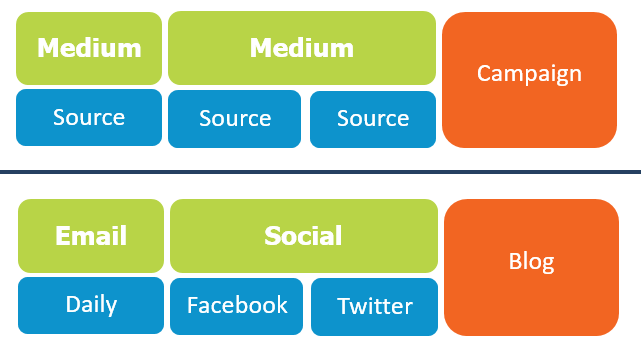
The relationship between Medium and Source is similar to the relationship between the Event Dimensions of Action and Label. Mediums are high-level groupings that aggregate data from many different acquisition points. Sources are more specific descriptions of where traffic came from. There is no equivalent of a Category, because all traffic sources can be compared against each other in terms of volume and visit value, but Events of different Categories may have no meaningful comparison.
A Medium usually represents a way of pushing your message out to potential visitors, or sometimes it represents a type of payment structure for acquiring traffic. Some common examples of Mediums are Paid Search, Display Ads, Social, Email, and Print Media (which is usually tracked through Vanity URLs). Like with Events, it is important to think about which traffic sources should be aggregated and which should be separated.
For example, a visit from a banner ad on Facebook should probably not be aggregated together with a visit from status update on your Facebook page. Depending on your campaign strategy, you may aggregate it with banner ads on a news site under the Medium of “Display,” or you may want to separate it with a Medium of “Social Advertising.” That visit shouldn’t be aggregated with a link form someone’s status update, because those two visits are the result of two different types of marketing efforts, and represent two different types of engagement with your messaging.
Sources are more specific, and should identify the exact place where a user clicked on a link to your site. For a Display ad, this should be the site and page of the ad that was clicked; for Email, it should identify the specific email; for Social Media, it should identify the piece of posted content. For other Mediums, keep to the guide that a Source is something that you want to compare to other Sources from the same Medium, and should be at the level of granularity where that is useful.
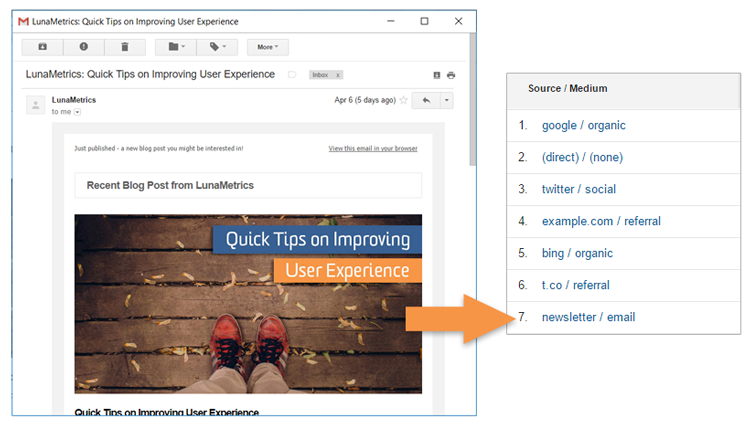
For example, email marketing can be lumped together under the Medium of “Email,” and the source can be set to answer the question, what type of email was sent? In this case, it might be helpful to differentiate the lists that you’re sending emails to (“Newsletter” vs “Survey”) or perhaps the event that triggered an email (“Subscribe” vs “Purchase”),
Campaigns
The Campaign dimension is different, because it is neither more general nor more specific than Medium or Source. Unlike the Event Dimensions, Campaign does not fit into a strict hierarchy with the other Traffic Dimensions. It sits off to the side, and lets you group your traffic reports by business object, in a way that cuts across multiple Mediums and Sources. The Campaign parameter should group different tactics together if they are part of the same marketing initiative or driving towards the same business goal.
As an example, imagine you are running two marketing efforts:
- A Product Launch announcement, with broadly-targeted banner ads, and an email blast.
- A Retention campaign targeted at former customers, with personalized emails and remarketing banner ads.
When reporting on these different marketing efforts, you would want to group together the Banner and Email visits from the product launch campaign into a single report, while also excluding the Banner and Email visits from your retention campaign. The Campaign report lets you do that, by drilling down into a Campaign name and seeing the Mediums, and then Sources, that were utilized in that Campaign.
What counts as a single campaign varies greatly from one organization to another. A campaign could last days, or weeks, or months; A website might run one campaign at a time, or a dozen. When deciding how to name your campaigns, ask yourself: How do I want to report on my traffic? When you want a separate report for some of your traffic, give it a new campaign name.

Conclusion
The value of collecting data is the value of the insights that you get from that data. You can make your data more valuable with naming conventions for Events and Traffic Sources that let you easily build meaningful reports. Use shared values in common dimensions to report on different Events together, and use the Campaign variable to report on different initiatives or business objectives.