Buy‑To‑Cart Rates By Digging Deep In GA Enhanced Ecommerce

Enhanced Ecommerce in Google Analytics is great because it gives an amazing amount of detail about how users interact with individual products. It has a wealth of reports about where users saw products, whether they viewed the product detail page, added the product to their cart, and ultimately made a purchase.
However, you may start to ask yourself questions that are difficult to answer with the standard reports. One common example we ask about ecommerce is something like the following:
If someone adds something to their cart, what is the likelihood that they ultimately make a purchase?
This is easy to answer within a single session in Google Analytics using the enhanced ecommerce reports. But what if you’d like to answer it over the course of, say, the next 30 days—what’s the likelihood that a user put something in their cart and then purchased at some point later?
This is something we need some user-level data to answer. There are a couple of ways to get at this:
- Using a custom dimension, segments with a custom report, and some data munging in Excel
- If you have GA Premium, using BigQuery
Let’s take a look at how you can get this data through either of these methods.
First Things First
In either case, I’ll assume that you’re using Enhanced Ecommerce in Google Analytics. (You could also be using the standard ecommerce transaction tracking with an event or pageview that measures cart additions, but the details will be different, so you’ll have to do some adaptation of the methods here.)
If You Don’t Have GA 360
If you don’t have Google Analytics 360 (Google Analytics Premium), we can cobble together this data with a combination of several features in Google Analytics. Here’s what you’ll need:
1. A custom dimension for Client ID.
The Google Analytics Client ID is the identifier stored in a user’s cookie, and the method by which GA recognizes returning users. We’ll need it to match up sessions from users over time as they add things to their cart and make purchases. Here’s a great blog post from Simo Ahava about recording this custom dimension using Google Tag Manager (along with some other identifiers you might find useful in other sorts of detailed analysis). Remember these values will only be collected going forward from the time you set them up, so you’ll have to wait a while to gather data before you can use it.
2. A custom report to see that custom dimension and export it to Excel.
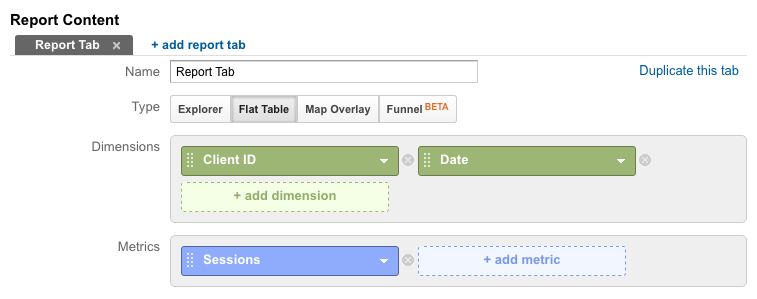
There aren’t any standard reports that show custom dimensions by default, so we need to create a way to view them. You can find more details in this blog post, but here’s a sample setup that includes our Client ID custom dimension and the date.

Here I’m using a “flat table” custom report, which strips off some of the fanciness like charts in favor of a format that’s easy to export, which is what we’re eventually going to do.
3. Segments to slice out the users who added to their cart or made a purchase.
We’ll need two segments to apply to our custom report: one that filters sessions where someone added something to their cart, and another for sessions where a purchase occurred.
The latter already exists in the built-in system segments, and it’s called “Sessions with Transactions”. The former we can create as a custom segment, like so:

Here’s a handy link you can use to save that yourself: Sessions with Add To Cart
Why not sequence Segments?
If you’re familiar with the advanced features of segments, you might wonder why I didn’t just use sequencing segments to get users who added something to their cart and then later purchased (and the inverse), rather than using dates in the custom report. There are a couple of reasons. With the sequence segments, there’s not a good way to get at a distribution or measure of the number of days that elapse between add-to-cart and purchase. We don’t know if it happened the same day or many days later, which may be important and valuable to understand.
Second, such a segment would by necessity be a user-based segment, which means we can only use it on a maximum date range of 90 days. That’s probably enough for many sites, but maybe not for large, considered purchases.
4. Export to spreadsheet, sort, and match.
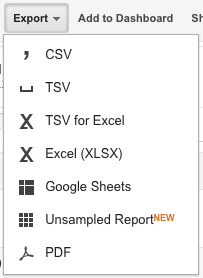
Now that we’ve created our custom report and segments, we can apply each segment to the custom report (one at a time) to get two lists: client IDs that added something to their cart, and client IDs who made a purchase. We can use the Export feature to export to Google Sheets or Excel.

Make sure you increase the number of rows visible in the report in the dropdown at the bottom so you get them all. If there are more than 5000 (the max), you may need to page through and export several times to get all of the rows.
Note: Since this analysis uses custom reports and segments, you should also be careful about sampling. Watch out for the sampling message at the top and make sure you see “100% of sessions”. If you don’t, you’ll want to reduce the date range to get unsampled data, exporting multiple times with different dates and putting the results together in your spreadsheet.

Once in a spreadsheet, we can use VLOOKUP (docs for Excel, Google Sheets, if you’re not familiar with lookup functions) to match up those columns and find purchases (or the absence of a purchase) for each of the users who added something to their cart. You can also use date formulas to calculate the number of days elapsed between purchases. There are several metrics you might define based on these data:
- Buy-to-Cart Rate within N days: what percentage of users who added something to their cart made a purchase within N days? (You decide what values of N make sense for you.)
- Average Purchase Lag: how many days elapse, on average, between adding to cart and purchase? Or, rather than focusing on the average, look at the distribution. (Notice, again, you have to place an upper limit on the number of days—are we going to consider someone who adds something to their cart and comes back a year later to purchase?)
Note: Depending on what amount of elapsed time you are interested in between cart additions and purchases, be careful about purchases close to the beginning of your date range and cart additions close to the end. It’s not fair to say “This user added something to their cart but never made a purchase” when the cart addition happened on the last day of the data you’re looking at (they may have come back just one day later and completed that purchase). Pull a long enough date range that you can look at data from the middle and throw out the ends as necessary to make conclusions.
If You Have GA 360
If you have Google Analytics 360 (Google Analytics Premium), this is all much easier because of BigQuery, a database you can use to access your detailed, session- and hit-level web data.
There are several advantages to doing this in BigQuery rather than through the GA interface:
- No custom dimension setup necessary
- No chance of running into sampling
- Digging down into more detail (like at the SKU level)
- The ability to easily group by user without doing a bunch of comparisons in a spreadsheet
The BigQuery export schema for Google Analytics includes all of the Enhanced Ecommerce data such as Add to Cart and Purchase, Product SKUs, as well as an identifier based on the Client ID. Using all of this, we can compose a query that gives us a dataset much like the one we created above from segments and Excel. Here’s an example query that even breaks down behavior by individual SKUs (so that we can say, users who added this particular product to their cart and then later purchased that same product).
SELECT
    fullVisitorId AS Client_ID,
    hits.product.productSku AS Sku,
    MAX(IF(hits.eCommerceAction.action_type=='3' AND
           hits.product.isImpression IS NULL AND
           hits.product.productSku IS NOT NULL, date, null)) AS Add_To_Cart_Date,
    MAX(IF(hits.eCommerceAction.action_type=='6' AND
           hits.product.isImpression IS NULL AND
           hits.product.productSku IS NOT NULL, date, null)) AS Purchase_Date
FROM
    TABLE_DATE_RANGE(
        [XXXXXXX.ga_sessions_],
        TIMESTAMP('2016-01-01'),
        TIMESTAMP('2016-01-30'))
GROUP BY Client_ID, Sku
HAVING
    Add_To_Cart_Date IS NOT NULL OR
    Purchase_Date IS NOT NULL
LIMIT 1000
Here, we basically were able to skip over all the steps above and get right to the data set we want to analyze (no custom dimension, segments, custom report, or VLOOKUP in a spreadsheet). GA 360 makes it easy!
The types of questions we can explore are still the same: lag between cart addition and purchase, the buy-to-cart rate, etc. And here, we’re even able to do that on a per-product basis (since we have included SKUs).
And Then What?
What do you do once you have this data and some metrics based on it? You can use it to inform how you market to users who have previously been on the site (through remarketing ads in display and search, or email followups and offers, for example). This analysis will help you understand how those tactics help move the needle on how likely a user is to purchase, versus what they were likely to do anyway. And if you have SKU-level data, you might even take different tactics for different types of products that perform differently.
Whatever you do with the data, I hope this has been an eye-opening example into wringing value from Google Analytics data beyond its standard reports. What other ideas do you have for delving into web data for valuable insights?


