Report Multiple Categories With Custom Metrics In Google Analytics

In an earlier blog post I covered how to report multiple categories with a custom dimension in Google Analytics – you string together all of your categories in a single value, and then separate them using GA dashboards, Google sheets, or Excel.
You should stick with the custom dimension solution if you have more than 20 categories. This is especially true if the number of categories is unknown (in the case where new ones may appear at any time).
If you have fewer than 20 categories and you know exactly what they are, there’s another option: custom metrics!
Let’s say you have a Request Info form where prospective students can indicate their interest in one or more programs. You want to count the number of times each program is selected, but you only want to track one form submission no matter how many programs a student is interested in.
As long as you don’t have too many choices on the form, custom metrics are a good solution. With custom metrics, you can create an amazing report like the one below.

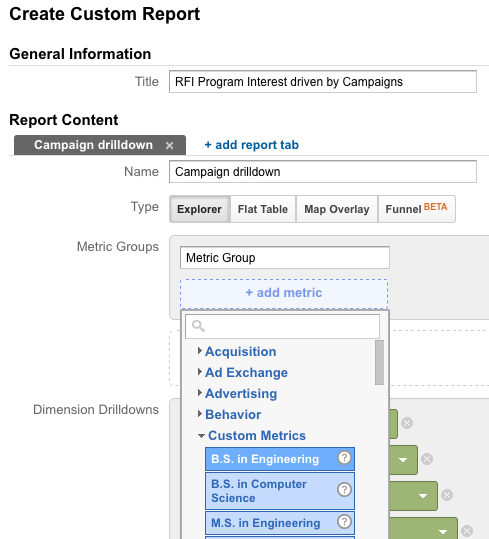
You can set up this custom report in Google Analytics and see which campaigns are driving interest in each program on your Request Info form.
Step 1: Create a Custom Metric for Each Category
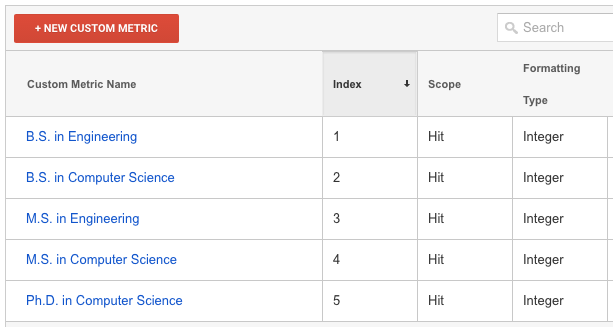
In the Admin panel in Google Analytics, go to Property Settings, Custom Definitions, Custom Metrics. Click the red button to create a new custom metric with hit scope and integer format. Enter the name of the category, e.g. “B.S. in Engineering” and then click Create and Done to save.
Repeat this process for each category. When complete, you’ll see a list of all your metrics and their index numbers.

Keep the index numbers handy – you’ll need them when you add tracking code for custom metrics to your Request Info form.
Step 2: Add Tracking Code for Custom Metrics
Just like custom dimensions, custom metrics need to be set before or at the same time you send an event or pageview. Custom dimensions and metrics never get sent to GA by themselves. Instead, they need to be sent with an event or pageview hit.
In the case of a Request Info form, you’ll need to determine what boxes were checked when the form was submitted. This can be part of the form validation script. Set the custom metrics and send a Google Analytics event when the form is successfully validated.
In your form validation script, you’ll add either Universal Analytics tracking code OR data layer pushes (to be used by Google Tag Manager) to send custom metrics with events.
Universal Analytics Tracking Code – Note that you want to set all the values to 1, which will simply count every time a student indicated interest in each program. In your custom report GA will sum each custom metric for you, the same way it sums most metrics in the standard reports.
Of course, you would only set the value to 1 if the checkbox for that program was checked. Use conditions in your script. If all five programs were checked, the resulting code would look like this:
ga('send', 'event', 'Request Info Form', 'Submit', {
   'metric1': 1,
   'metric2': 1,
   'metric3': 1,
   'metric4': 1,
   'metric5': 1
});
I’ve sent an event category of ‘Request Info Form’ and an event action of ‘Submit’ but you could add an event label or other parameters if you wanted them.
Data Layer Pushes for Google Tag Manager
If you’re using Google Tag Manager, then you’ll want to push info to the data layer in your script as shown below. Remember to set values to 1 only on the condition that those boxes were checked when the student submitted the form.
var dataLayer = window.dataLayer = window.dataLayer || [];
dataLayer.push({
   'event': 'submitRFI',
   'metric1': 1,
   'metric2': 1,
   'metric3': 1,
   'metric4': 1,
   'metric5': 1
});
You can then tell Google Tag Manager to listen for the event ‘submitRFI’ and trigger your Google Analytics event tag, where you’ve added custom metrics.

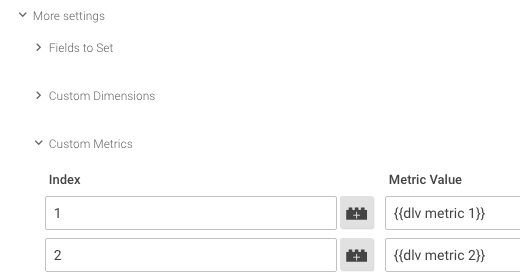
The value of each custom metric comes from a variable you define in Google Tag Manager to read the corresponding value from the data layer. {{dlv metric 1}} refers to the value of ‘metric1’ in your data layer push. It will be 1 or 0, depending on whether or not the student checked the box for B.S. in Engineering.
Step 3: Create a Custom Report
Custom metrics don’t appear in GA unless you create a custom report or dashboard with them. You have the same options for reporting as with custom dimensions.
To create a report like the one at the top of this post, go to the Customization tab at the top of the Google Analytics interface, between Reporting and Admin, and click the button for New Custom Report. Give your report a name (“New Custom Report” is a lame name, like “All Web Site Data” – you can do better).
Click the blue button to add metrics. Pro Tip: Use the search box, don’t scroll to find them. Add some dimensions like Campaign, Medium, Source, and Landing Page. Then save the report in the view(s) where you need it.

Other Examples of Categories and Custom Metrics
It’s easy to extend the form submission example to other situations where you might track a limited number of categories with custom metrics.
- other forms with multiple checkboxes checked, e.g. selecting one or more newsletters
- video play events, where the video belongs to one or more categories
- blog posts or articles that can belong to a small number of topics
- product pages where the same item is related to more than one category
For articles and product pages, you’ll want to send your custom metrics with a pageview hit instead of an event hit. You’ll still need to set the custom metrics either in Universal Analytics tracking code or in a data layer push to be used by Google Tag Manager.
Have you used custom metrics to track multiple categories? Did you encounter any obstacles or find a novel solution? Please share in the comments.


