Increase Your Google Analytics Page Speed Hit Limit
It’s not much of a secret that slow-loading pages on your site decrease the chances of a visit converting. Walmart, Google, and others have released data that point to real-world impacts from sluggish page load times. Enter the Page Timings report in Google Analytics – chock-a-bloc full of actionable metrics. You can see exactly which pages on your site are loading slowly, and you can apply Segments to focus on just the traffic you’re interested in.
There’s just one catch – the data is pretty heavily sampled. By default, Google Analytics collects timing data on just 1% of users who visit your site, or 10,000 hits per day, whichever comes first. You can increase the percentage of users that are sampled, but once you hit 10,000 hits, you’ll get no more data. My colleague Samantha Barnes has written an excellent guide that fleshes out this feature toe-to-tip.
What I’m here to tell you today is that you actually can exceed the 10,000 hit limit for your page timing data. How’s that, you’re asking? By using Events, of course.
How It Works
The page timing data you see in Google Analytics isn’t being gathered by any kind of JavaScript witchcraft on the browser: they come from the Navigation Timing interface, an API exposed by modern browsers that holds data on a slew of different and important steps the browser takes on the way to rendering a page. The Mozilla Developer Network has a a great guide to this API here.
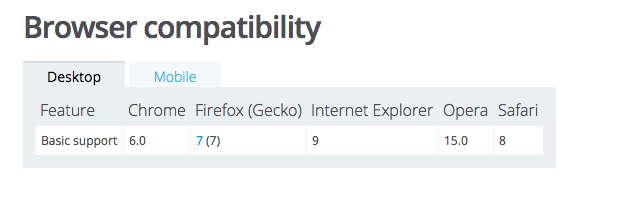
Since this interface is available to any Joe Schmoe, we, too, can use it to get data about how long our pages take to load.
Capturing The Data
You can implement this through JavaScript on your page or through Google Tag Manager. We’ve even created a Page Load Timing GTM Recipe to make your life easier!
I’ve also provided instructions below:
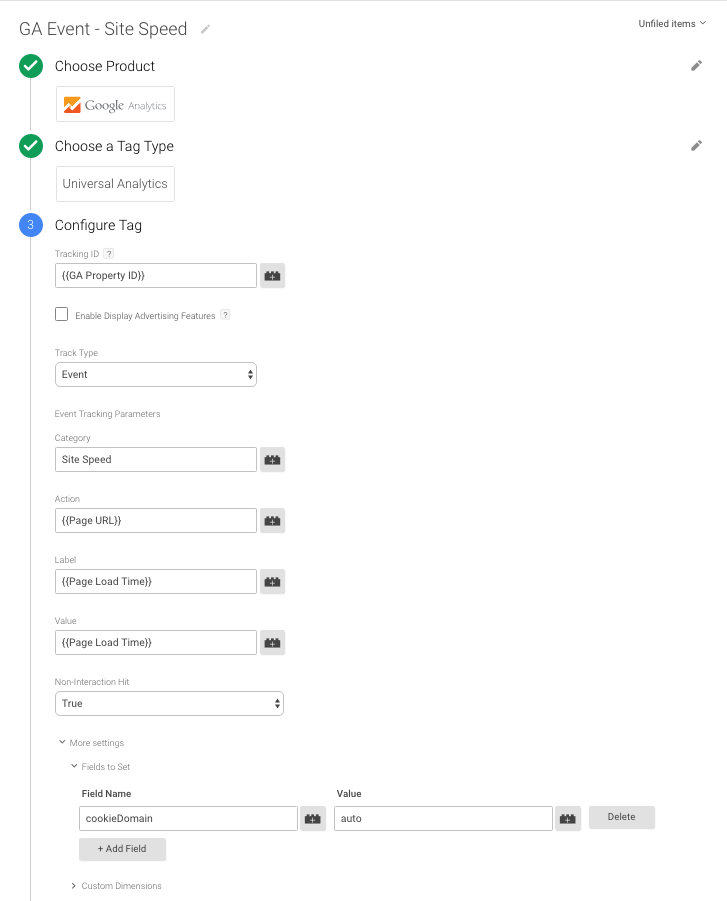
- Create a new Google Analytics Event. Fill in all the normal information, your Google Analytics Tracking ID, etc.
- Give it whatever Category name pleases you best, I used “Site Speed”
- For the Action, fill in the Variable
{{Page URL}}. Either type this, or choose it from the lego dropdown box. - For the label, click the Variables drop down and choose Create a new Variable.
- Select the Variable type Custom JavaScript and paste the below into the field:
function() {

  var timing = window.performance.timing;
  var ms = timing.loadEventStart - timing.navigationStart;

  return Math.round(ms / 100) / 10;

}- Finally, select ‘True’ for the Non-Interaction Hit field. We’ll be firing this automatically and we don’t want this to artificially affect our bounce rate.
In the end, your Event should look something like this:
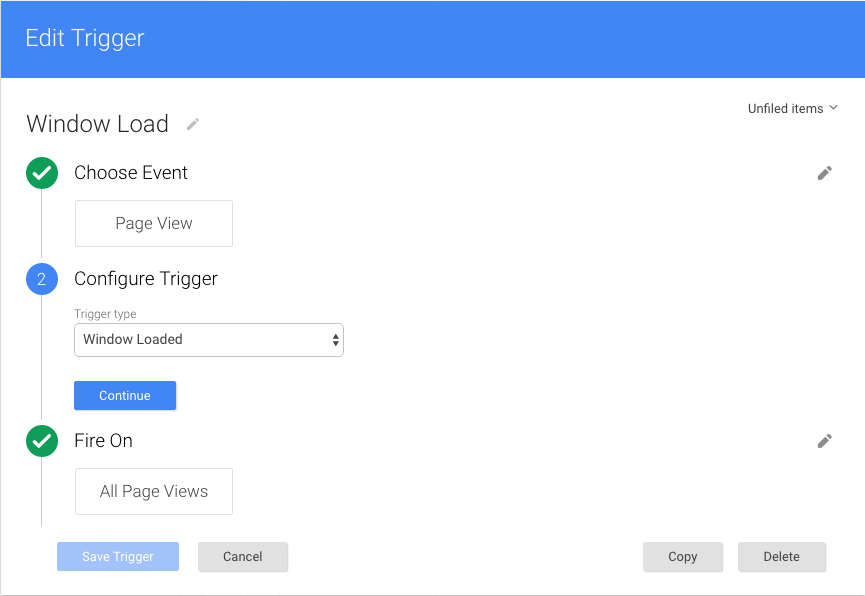
Once you’ve got that configured, you’ll need to create two Triggers – one to fire the tag, and another to block it when the API isn’t available. The firing Trigger is super simple – we’ll just use the built-in Window Load Pageview Type:
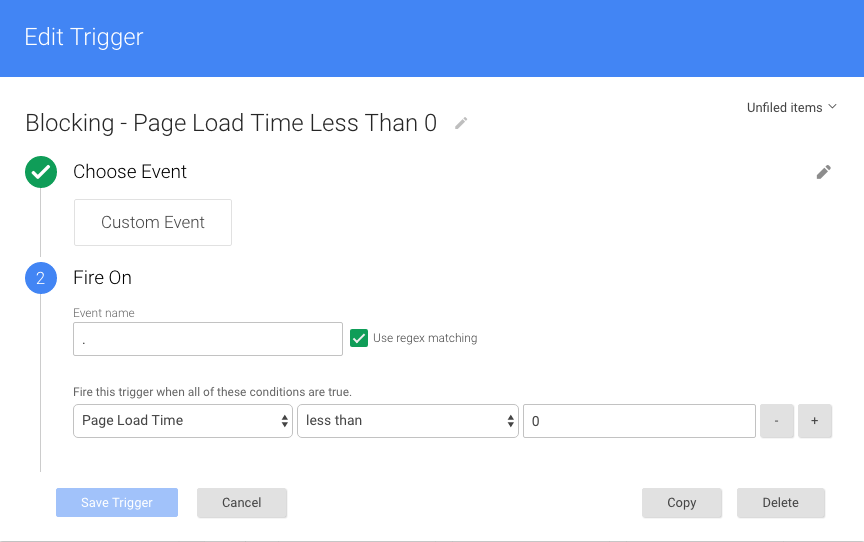
Next, we’ll need to create our blocking trigger; it should look like this:
Why Not Custom Metrics?
Custom Metrics are a great choice! If you’d like to gather the same metric in a Custom Metric, or pull out additional Timing API data and plug it into Events there, be my guest. The reason I’m recommending an Event here is that we need to fire the Event on window.load, which can come well after we’d like to send a Pageview, and thus we have to fire a second hit – so why not just use that hit for our data. If you’ve already got an Event firing on every pageview, you can just use a Custom Metric instead.
Keep in mind that adding this Event will effectively double the hits you’re generating; if you’re running close to that 10 million hit limit on a monthly basis, you should sample this hit, either through the sampleRate Field To Set or another Blocking Exception like the Blocking Trigger #7 Jon Meck outlines here.
So What Does This Do For Me?
Using your page speed timing data, you can learn which pages of your site are taking an abnormally long time to load. By sorting first by the Label, you can drill into just the pages that are going over a certain threshold, e.g. 2.0 seconds or higher, and begin to investigate why they’re not up to snuff. If you want to be really fancy, try the new Histogram Buckets feature in version four of the Core Reporting API. Some additional tools that will help you along your way:
- WebpageTest.org, which allows you to run up to 9 simultaneous loads of a page and returns a handy waterfall of the results
- PageSpeed Tools, which provide concrete recommendations on how to improve the performance of your pages
- Chrome’s Timeline Tool, found in the developers console
Armed with your data and these tools, you can drastically improve the performance of your site (and hopefully your conversion rate, too).
News & Insights
Related Perspectives


