Digging Deeper With Attribution Reports In Google AdWords

I often joke at our AdWords training seminars that some of the most helpful tools in the interface are tucked away where nobody will find them.
When users head for the “Tools” section at the top, most make a beeline for the Keyword Planner or Ad Preview tool. Often, they seem to overlook what I consider one of the most interesting sections: Attribution.
It seems like it would be a pretty popular spot. Who doesn’t love measuring conversions and success?
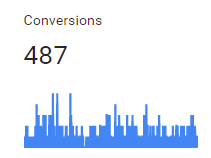
But it can be an intimidating place. There are numbers, tables and charts that look like elevation maps for mountain stages in the Tour de France.

See?
So fear not!
I’ll walk through some of the cool reports available to us in this underexplored corner of AdWords and give some suggestions on how to use them. By the end, you’ll hopefully know more about attribution tools in AdWords than Bill Gates does about dabbing:

Before We Begin
If you are unfamiliar with the different options available for counting conversions, please take a moment to read my blog post on AdWords conversion tracking. This blog expands upon some concepts in Stephen’s post, focused on cross-device reporting in AdWords. Some of the information in those article will be reviewed here and it will give you a nice primer. We want to know what we’re giving credit for, and how we’re dispersing it, so our account avoids looking like this:

Conversions? Who? For him? Me?
Secondly, when we’re discussing attribution here, we are only discussing how credit is dispersed among AdWords campaigns (or ad groups or keywords). AdWords attribution tools only care about AdWords, unlike Google Analytics, which takes your other marketing channels into account.
This doesn’t mean the tools won’t work on goals imported from Google Analytics; they will. It just means that when we’re discussing how we attribute success to a campaign (or an ad group, or keyword), we’re only thinking in the context of AdWords campaigns, not other channels like organic search, social, or direct traffic.
So, with that in mind, let’s dive into some cool attribution reports available from AdWords.
Device Path
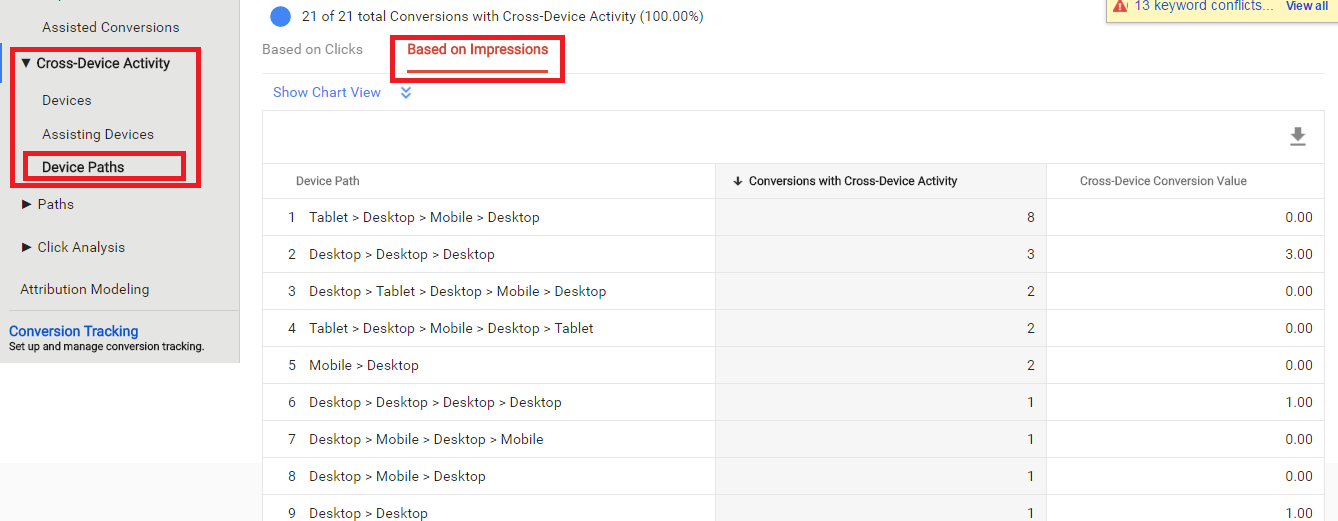
Among my favorite types of reports available in this section are “Path” reports, which show how a user moves from element to element along the way to completing a conversion. The Device Paths report, which can be found on the lefthand side under Cross-Device Activity, shows how our customers transition from device to device before converting.

Device Paths Report
We can glean a vital piece of information from this: What device users utilize at the beginning, middle and end of their converting experience. We can drill down to which devices had clicks by selecting “Based on Clicks,” or we can view which devices users saw an ad by selecting “Based on Impressions.”
What can we do with this information?
Well, if we know users typically begin their research on their tablet and convert on their desktop computer, we can add bid adjustments on these devices in certain campaigns to be more visible. So in this example, we would bid up on our top of funnel campaigns if the user is on a tablet (up to 900%) and bid up on our end of funnel campaigns if a user is on their desktop.
Not sure which campaigns typically start, support, and convert your users? Then check out these reports…
Click Analysis & Top Paths
First, to get an idea of where campaigns typically fall in our funnel, we can look at the “Click Analysis” reports. We can see which campaigns generate the first click in a conversion path most often in the First Click Analysis report, and which ones generate the last click in Last Click Analysis.
We can also drill down to be more specific by clicking the dropdown just above the reporting table, where we could also see which had groups and keywords generate first and last clicks most often.

First Click Analysis Report
We can use this data to determine which elements in our account serve as the opening interaction and the closing interaction in a conversion path most often. However, we can’t rely on this alone. After all, there might be campaigns in the middle that are left out of this analysis.
To understand how users move between campaigns (and ad groups and keywords), we’re going to head to Paths > Top Paths. Here, we can see the series of campaign interactions that lead to a conversion. Depending on how complex your account is, you might only see one interaction or you might see several.
In the example below, the user interacted with 6 ads in 4 different campaigns before converting.

Top Paths Report
What can we do with this information?
- We can utilize this data in conjunction with our device paths to refine our bids by device based on where these campaigns fall in a conversion funnel.
- If we typically see single-interaction paths, we might choose an attribution model like last-click, as we aren’t as worried about other assisting campaigns losing out on credit. Likewise, if we see paths with several interactions, we might want to choose an attribution model that spreads the credit out, like a linear model. More on that in the last section.
- We could decide whether to use a conversion-based bidding strategy like Target Return on Ad Spend or Enhanced CPC on certain campaigns. For example, if you’re using a last-click attribution model, where all of the credit for a conversion goes to the last campaign a user interacted with, you might want to only use a conversion-based bidding strategy for campaigns that fall further in your funnel. If you use a first-click attribution model, you might want to do the opposite.
- If we see common patterns emerge, we could build remarketing audiences and add them to campaigns further down in the funnel. We can then bid up on them to be more visible and move users along.
This report gives you a relative sense of how long your lead or purchase cycle is. The more interactions, the more likely you are to have a longer lead cycle. But in order to get an even better sense, we need to head to…
Time Lag
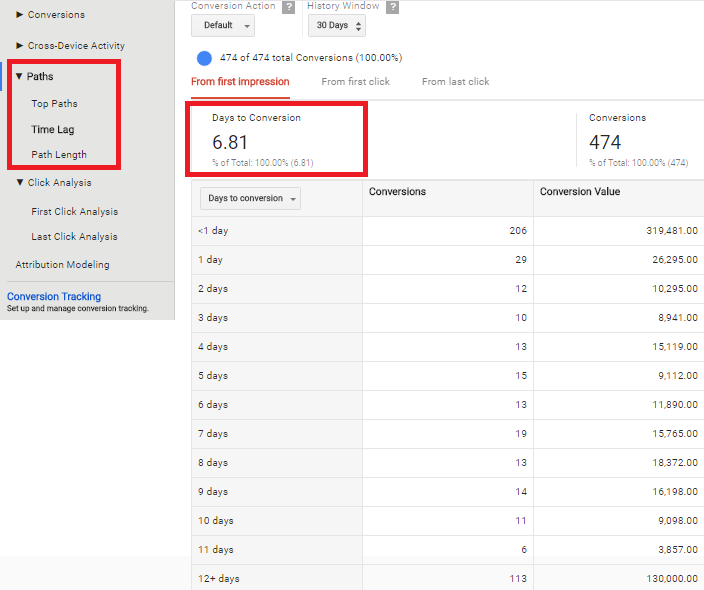
Right below the Top Paths report lives the Time Lag report. Here, we can see how long it typically takes a user to convert, either from their first impression, their first ad click, or their last ad click. This gives us an idea of how long our lead cycle is, allowing us to choose an appropriate conversion window.
In this example, we see that about half of our users often convert within one day of their ad click. However, the other half takes anywhere from 2 to 12+ days to convert.

Time Lag Report
If we play around with the History Window button at the top, we can see if we pick up any additional conversions looking back 60 or 90 days, as opposed to 30. If we see the numbers in the 12+ row increase substantially the farther back we look, and we’re using a default 30 day window, we might be losing out on conversion credit. Depending on how conservative you want to be in measuring the success of your campaigns, this might not be a bad thing.
For example, you might want to narrow your window depending on your product. Someone like Chipotle selling burritos online probably doesn’t want to give the credit to an ad a user saw a month ago, let alone 3 months ago. Someone selling a house probably would.
Attribution Modeling
Way down at the bottom of the reports list, we finally come to Attribution Modeling. Here, we can compare how different attribution models affect how we disperse credit for our conversions to different campaigns.

Attribution Modeling Report
Here are the different models available to us:
Last Click: This is the default setting, where 100% of the conversion credit is given to the last ad a user clicked.
First Click: The opposite of last click. All credit is given to the first ad a user clicked on.
Linear: Conversion credit is spread out evenly amongst all the ads a user clicked on in the conversion path.
Time Decay: This model attributes more credit to ad clicks that happen closer to the conversion. It uses a 7-day half-life to break down credit. So a click 8 days before a conversion gets half as much as a click 1 day before.
Position-based: This model gives 40% of the credit to the first click, 40% to the last click, and spreads the remaining 20% over the remaining clicks.
Data-driven: If you have enough conversion data, you have access to this special sixth model. It uses your existing data to make a determination on how to disperse credit amongst your campaigns. To be eligible, Google says you need “at least 20,000 clicks and a conversion action must have at least 800 conversions within 30 days.” If your numbers dip below a certain threshold, you can no longer use the model.
Models that give the credit back to one click, like last and first click, are more conservative than ones that disperse credit. These tend to overestimate branded search (last click) and top of funnel, expensive terms (first click), and I don’t tend to use them.
This is not to say the other models don’t have flaws; they do. Linear underestimates crucial keywords and overvalues others, time decay has the same problem as last click (but is more balanced), and position-based underestimates interactions in the middle of the funnel. It all depends on whether you care more about the opening acquisition, the middle stages, or the closing interaction.
While I don’t think this report is the best for choosing an appropriate model (I typically refer to Top Paths), it is good for understanding how changing the model will affect your data.
For example, if you use a last click model, your branded campaigns might seem incredibly efficient while your nonbranded (and expensive) campaigns might seem horrible. However, if you compare a last click model to something like a position-based model, you might see that those campaigns closer to the top of the funnel play a critical role and decide to switch to a different model.
And that does it. Hopefully, instead of running away from the Attribution tools in AdWords, you’re measuring and celebrating success like this:


