Case Study: Audience Modeling With Google Analytics 360 And Google Cloud Platform


Google recently published a case study with LunaMetrics and PBS where we used Google Analytics 360, BigQuery, and Google Cloud Datalab to perform a clustering analysis on website audiences. The case study is worth checking out, but here’s a quick summary.
PBS.org is a digital content hub with supporting information and streaming video for PBS television programming. PBS has known that for a long time that; in the words of Amy Sample, Sr. Director of Strategic Insights, “there is no ‘average’ user of PBS.org – rather, there are categories of users who do different things.” However, the size of PBS’s data, over 330 million sessions in a year, makes it impossible to easily recognize patterns of behavior in web analytics data. So PBS worked on a Data Science Solutions project at LunaMetrics to apply data mining techniques to segment audiences.
This type of analysis enables opportunities for audience-based personalization to improve the onsite experience, as well as advanced reporting and advertising opportunities. You can read the full case study for more information, however, in this blog post, I want to take a few minutes to focus a little more on the process and tools involved in crunching this data.
Google Cloud Platform
We leveraged a number of Google Cloud Platform tools to complete this analysis.
The process started with Google BigQuery, since Google Analytics 360 offers an automatic export of data into this cloud database tool. BigQuery is a powerful and fast way to query the large dataset of web behavior data (on the order of terabytes) to distill and categorize into an input dataset for data mining. Here on the Luna blog, we’ve written lots about the uses for GA data in BigQuery and how to get started using BigQuery.
Extracting the Right Data

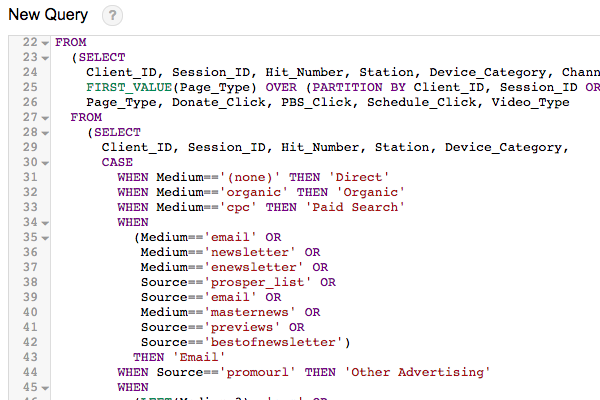
The first step was extracting the relevant data from Google Analytics data in BigQuery.
Even having distilled the data down into a size of gigabytes rather than terabytes, this was too large a dataset to analyze on a typical laptop computer. Dedicated computing hardware for a special project like this doesn’t really make sense, but Cloud Platform has our back with Compute Engine, which gives us the ability to spin up a powerful computational machine just for when we need it. Specifically, Cloud Datalab gave us an environment to run on Compute Engine with just the data analysis tools we need (see below for more details). We also used Cloud Storage to interchange data between these services.
Doing all this in the cloud, from data storage to querying to computation, means we never had to download the data locally. And because these are all managed services, we don’t have to worry about configuration, admin, updates, and all that IT stuff that gets in the way of getting the actual work done, because it’s all taken care of by Cloud Platform.
Cloud Datalab: Python Tools for Big Data Analysis
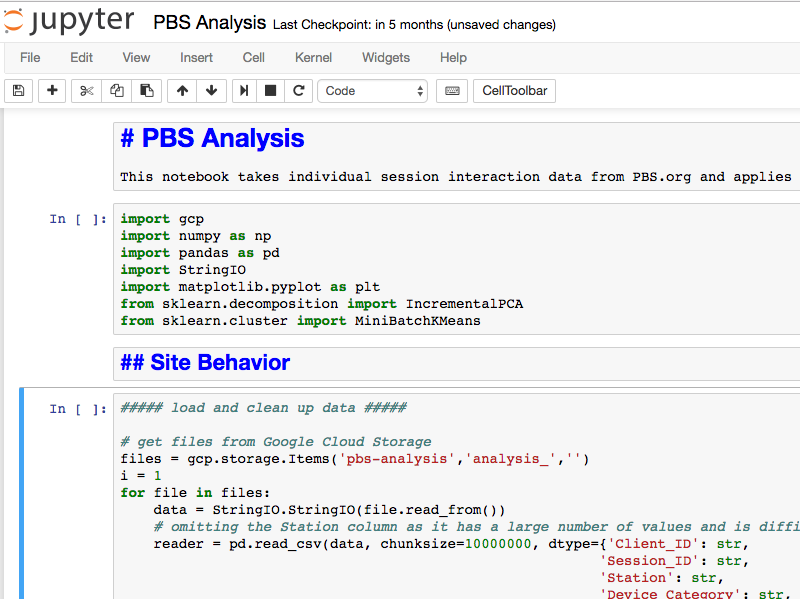
Cloud Datalab is a beta member of the Cloud Platform family. It allows an easy, one-click deployment of a tool called Jupyter to a Compute Engine instance. Jupyter is tool and a format for running Python code in a “notebook”, where you can combine documentation, commentary, data, and code all in one place. You can think of it as a lab notebook with built-in computation power, and it’s a pretty commonly used tool in Python. (It used to be called iPython, and you may know it under that name.)

Jupyter notebooks provide an easy way to analyze and document data with Python.
When you’re doing data science work, there are two main scripting languages you might turn to. One choice is R, which is designed specifically for statistical computation. We’ve written lots about R and Google Analytics in the past on this blog.
The other choice is Python, which is a general-purpose scripting language that now offers a number of libraries for data science work. If you’re already familiar with Python (and with Jupyter notebooks), this is an easy way to get started. The following libraries will get you off on the right foot:
- Pandas – reading, organizing, and filtering data, handling missing values, etc.
- NumPy – dealing with arrays and matrices
- SciKit-Learn – data mining and analysis tools
There are also a number of libraries for creating charts and visualizations. Pandas and NumPy handle a good deal of the underlying work around storing, reading, and manipulating data, but SciKit-Learn is where the magic happens. It includes modules for techniques such as regression, classification (image recognition, for example), and clustering.
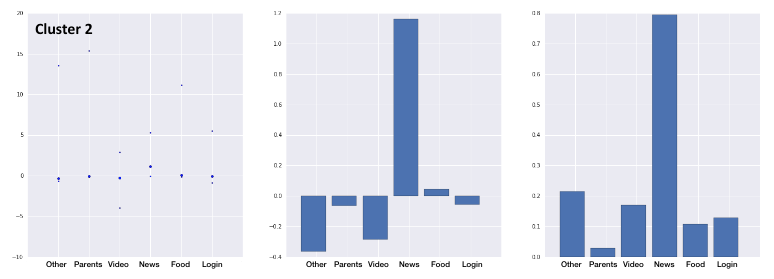
Clustering is the type of problem we were tackling with the PBS data: given user behavior, we wanted to group users into audiences who behaved similarly. A clustering algorithm does exactly that – essentially taking a set of data points and grouping them into “clusters” of points that are close together. SciKit-Learn offers several algorithms for clustering. The outputs of this clustering let us describe a number of distinct audiences for PBS, which can be further used to segment their data, tailor marketing, or personalize content.

Data mining algorithms clustered user behavior by similarity across multiple factors.
Conclusions
Google Cloud Platform provides an end-to-end environment for processing and analyzing data from Google Analytics 360. And with freely available Python tools like Jupyter and SciKit-Learn, you can play around with small datasets on your laptop, or crunch giant ones in the cloud, in the same formats and with the same tools. Install Jupyter today and you can get started. Or, if you have a Google Analytics 360 dataset and don’t know where to get started, our team at LunaMetrics can help.


