Using Google BigQuery Data In Your Data Studio Reports
Among its many benefits, Google Data Studio easily connects with Google BigQuery, giving you the ability build custom, shareable reports with your BigQuery data. Google Analytics 360 users that have set up the automatic BigQuery export will rejoice, but this benefit is not just limited to GA360 customers. Anyone with any data set in BigQuery can take advantage of this capability!
Since its release Data Studio has quickly become a preferred method of building clean, collaborative reports and dashboards. It offers far greater flexibility than anything you could build within the Google Analytics interface, and its direct connector to BigQuery makes it even more powerful.
This post assumes that you already have a BigQuery account. If you do not, but still want to follow along, there are a couple demo data sets you can access (I’ll point those out later).
Why Bring BigQuery Data into Data Studio?
There are a number of exciting opportunities to take advantage of when you pull data from BigQuery into your Data Studio reports. Here are a few examples:
- Visualize results from your own calculations and analysis on your Google Analytics or other data
- Combine data from various Google Analytics web properties
- Combine Google Analytics data with data from other sources
- Create funnels that you can’t build inside of Google Analytics
- … and of course, get unsampled reports!
Not only does Analytics 360 have the ability to bring Google Analytics data into BigQuery, but other Google tools also have data integrations, such as Firebase Analytics as well as ad tools such as AdWords and DoubleClick platform products through the newly announced BigQuery Data Transfer Service.
In this post, we’ll discuss the basic steps to connect your Data Studio report to your BigQuery data, and we’ll provide a few tips along the way.
How to Connect BigQuery to Your Data Studio Reports
The first thing you’ll want to do is go to datastudio.google.com and open up a new report (or an existing one that you want to work with). In this example, we’ll start with a new report.
Select Your Data Source
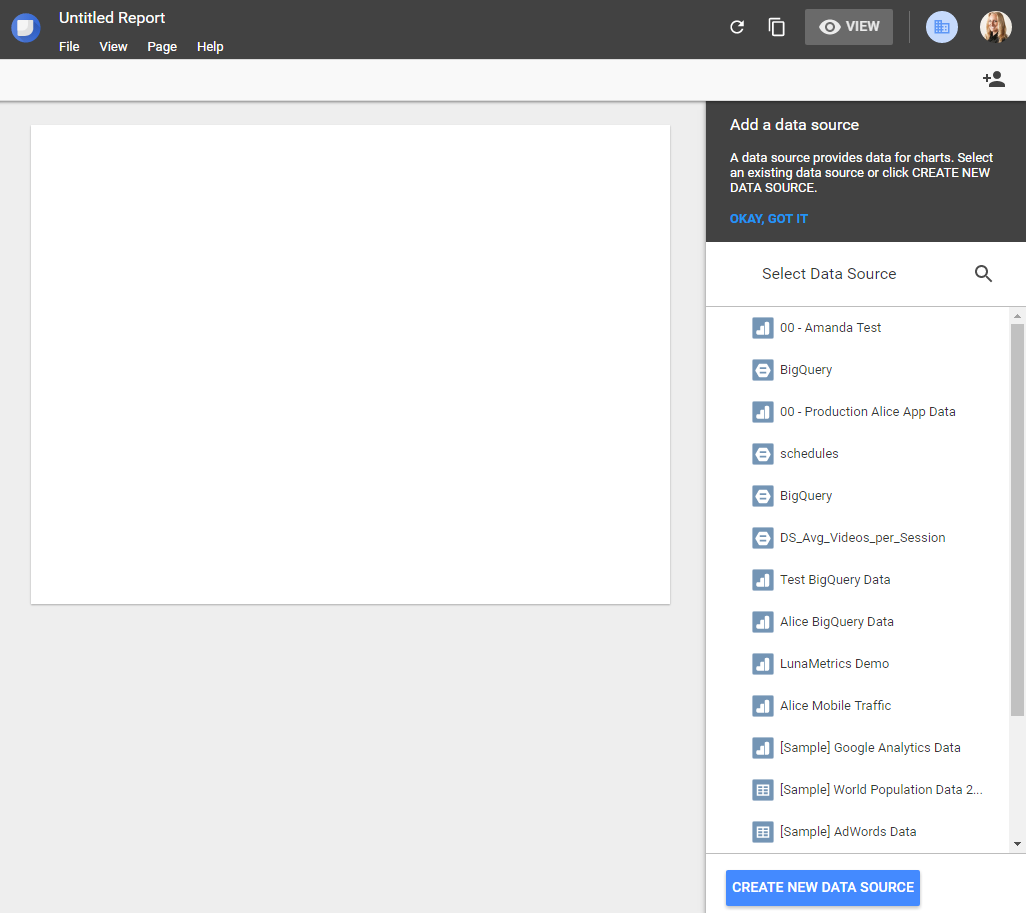
Next, you’ll want to add a new data source. There are a variety of available Connectors for Data Studio; we’re going to select BigQuery.
As soon as you select the BigQuery Connector option, you will immediately see a list of projects that you have access to. If you have not yet set up a BigQuery project, you can work with one of the Public Samples, as shown below:
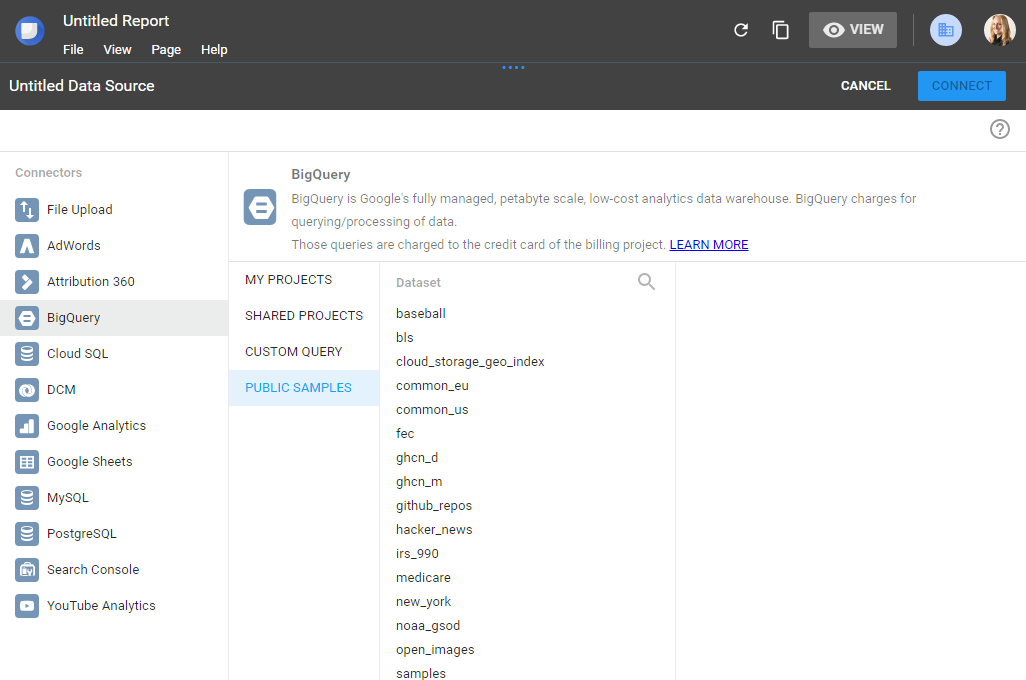
Note that if you are working with one of the sample data sets, you should take a look at how the data in that data set is structured in order to know how to query from it. Queries for Google Analytics data will likely be different than what you might use for one of these demo data sets. Visit bigquery.cloud.google.com to see the data sets available to your email account.
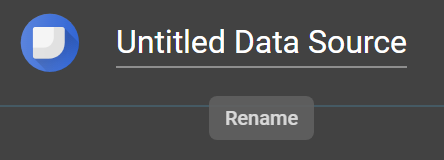
Also – now is a good time to go up the top left corner and rename your Data Source!
Projects/Tables vs. Custom Queries
One important distinction to note is the difference between connecting to a BigQuery project (such as a personal project, shared project or public sample project) compared to writing a custom query. Choosing a project allows you to select a pre-existing table that has already been created from within BigQuery. Custom Query (you guessed it) allows you to write your own query, and you can do so right from within the Data Studio interface.
Either option will allow you to access data in BigQuery and use it to build and customize your reports (such as dynamically selecting date ranges, which we’ll get to in a second). The key difference is the fact that you are actually building your queries from different locations: within BigQuery to build a project table or from within Data Studio entirely with a custom query. Depending on how comfortable you are with writing your own queries and the preferences your organization may have around data management, you may wish to have someone else on your team build the custom tables for you from within the BigQuery interface so that you can simply select from pre-existing tables when creating your Data Studio report.
If you have a pre-existing table to choose from, simply select it and then hit the blue CONNECT button at the top of the screen.
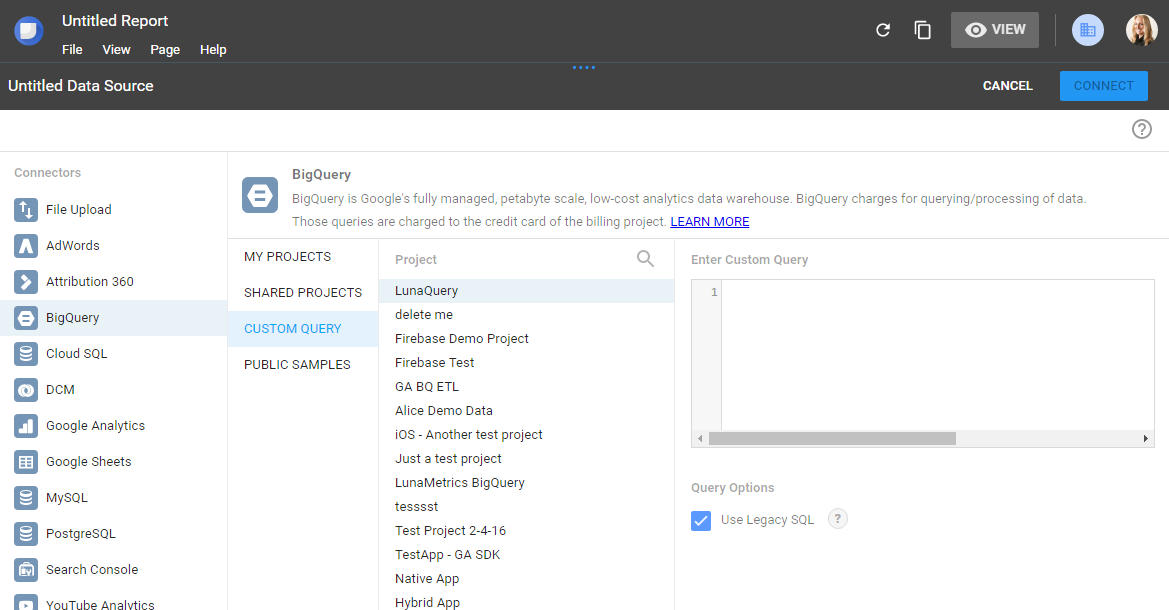
If you are writing your own query, select Custom Query and then chose which project you wish to pull data from. You will see a field where you can enter your custom query:
If you are querying Google Analytics data, check out the following resources to make sure that you understand the hierarchical structure of Google Analytics data in BigQuery:
- Querying Google Analytics Data from BigQuery
- The BigQuery Export Schema
- What’s Missing in the Google Analytics BigQuery Export Schema?
- The Google Cloud Platform’s Documentation on BigQuery
- The Google Cloud Platform’s Documentation on SQL Syntax, note that you can switch between Legacy SQL and Standard SQL
Dynamic Date Ranges
Regardless of whether you choose a predefined table or a custom query, you will likely want to make sure you are selecting a dynamic date range so that your report can continuously be updated automatically each time you view it.
For example, the following query will return the total number of sessions by date where a ‘Download’ event occurred:
SELECT
  date,
  COUNT(*) AS sessions
FROM (
  SELECT
    date,
    SUM(IF(hits.type='EVENT'
        AND hits.eventInfo.eventCategory = 'Downloads', 1, NULL)) WITHIN RECORD AS Total_Events
  FROM (TABLE_DATE_RANGE([XXXXXX.ga_sessions_], TIMESTAMP('20170101'), TIMESTAMP(CURRENT_DATE()) )))
WHERE
  Total_Events > 0
GROUP BY
  date
The TIMESTAMP(CURRENT_DATE()) piece will allow you to capture the most recently available data each time the report is run.
Add the BigQuery Data to Your Report
Once you have run your query successfully (an error message will appear if the query fails) you will see a list of the dimensions and metrics that you can now add to your report.

Easily Add a Custom Date Dimension
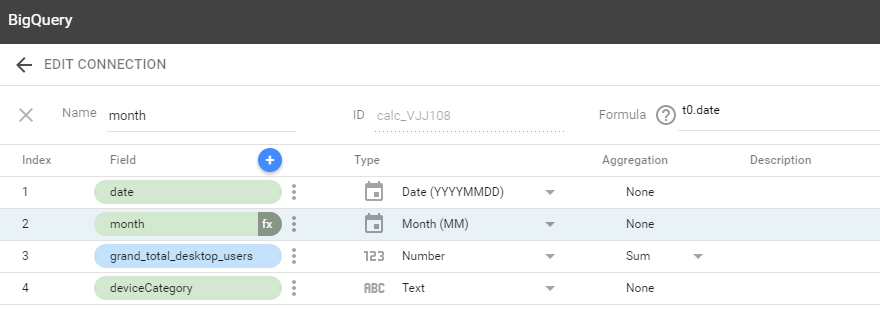
You can adjust the data type and aggregation if desired. You may also want to make a copy of the ‘date’ field and change its type to “Month (MM)” so that you can use months as dimensions in your charts in addition to specific dates:
Select ADD TO REPORT in the top right. At this point you will see a notification that tells you that all report editors will be able to use this data source –
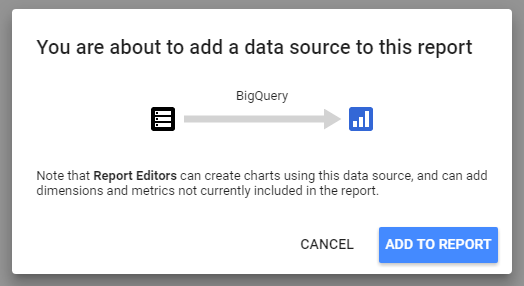
This is important because it should make you think about who is going to see this report and how it should be shared appropriately across your organization. You won’t want to bring in Google Analytcs or other data that you want to keep private. (You won’t see a notification in the Google Analytics interface about where that data is used in Data Studio reports)
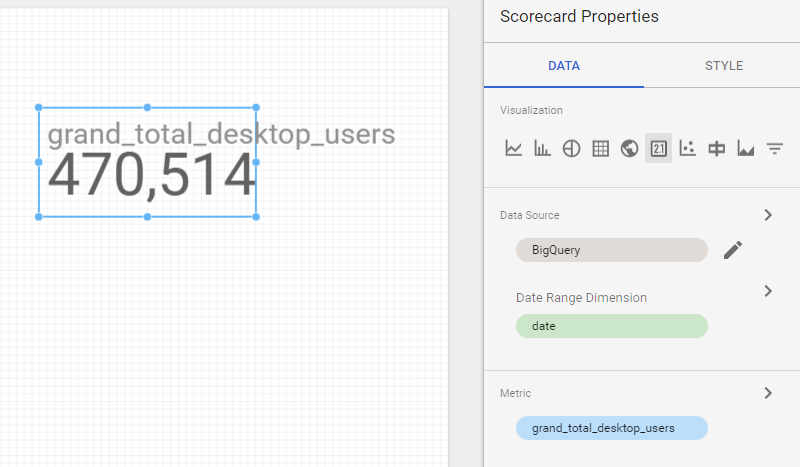
Add your data source and then you’ll be ready to start building your report with your new metrics and dimensions!
Considerations for Robust Reports
When you want to rely heavily on BigQuery for building your reports, it helps to think ahead and plan out all of the pieces of data that you want so you can use as few queries/connectors as possible. For example, instead of creating a query for all users who visited your site on a desktop computer, make your query more general and use the built-in filter functionality inside Data Studio.
In this example, we’re selecting all users by device category (all device categories) per day:
SELECT
  date as Date,
  EXACT_COUNT_DISTINCT(fullVisitorID) AS Users,
  device.deviceCategory AS Device_Category
FROM
  TABLE_DATE_RANGE([453317.ga_sessions_], TIMESTAMP('20170101'), TIMESTAMP(CURRENT_DATE()))
GROUP BY
  Date,
  Device_Category
ORDER BY
  Users DESC
Then, within Data Studio, we can use a built-in filter for our charts and graphs:
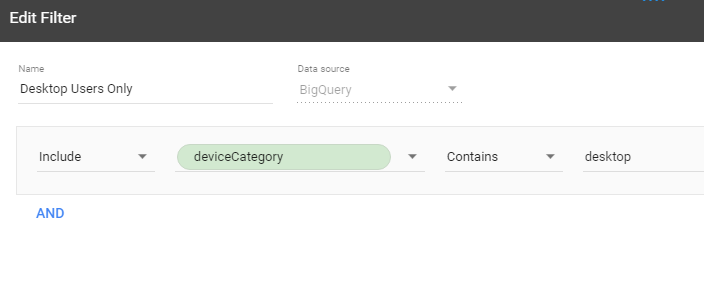
This is a very basic example, but using this approach allows us to have various sets of graphs for different device types without needing multiple queries.
How Will Data Studio Impact My BigQuery Bill?
Generally, you are going to be charged for each query to a BigQuery database. However, it is helpful to know that Data Studio will cache the data in your reports so that you are not charged for another query every single time the report is opened within the same day.
Tell us how you’re using Data Studio to visualize BigQuery data!