Gamify Your Life Goals With Google Assistant and Data Studio
As a child I had daily tasks and goals. I had to make my bed, clean my room, and brush my teeth. My mother, who is a savvy marketer, gamified our to-do lists by creating incentive charts. These beacons of daily progress lived on the refrigerator and earned a star for each completed task. Complete something, get a star.
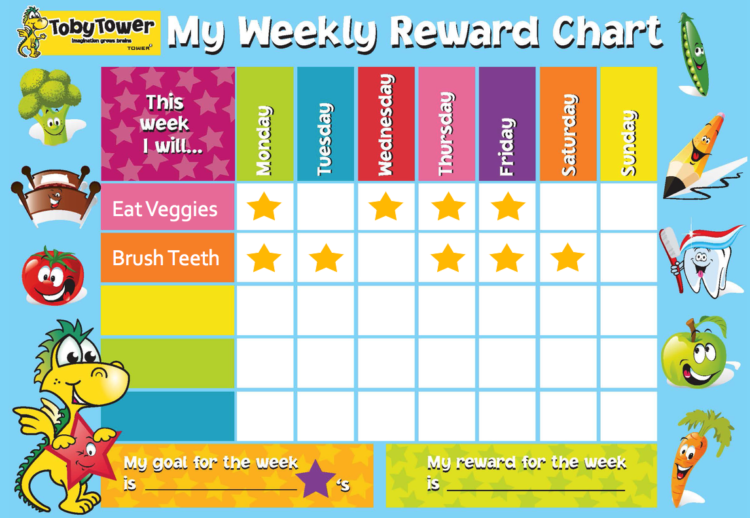
Now my life is digital — closely intertwined with my mobile devices — and the incentive charts must follow me to keep up. Between work and travel and chasing a young pit bull around the neighborhood, incentive charts bound to the refrigerator with a magnet are not an option. Or at least not a viable option.
A better solution is a mobile trigger combined with a visualization tool. This is how Google Assistant and Data Studio meet my needs.
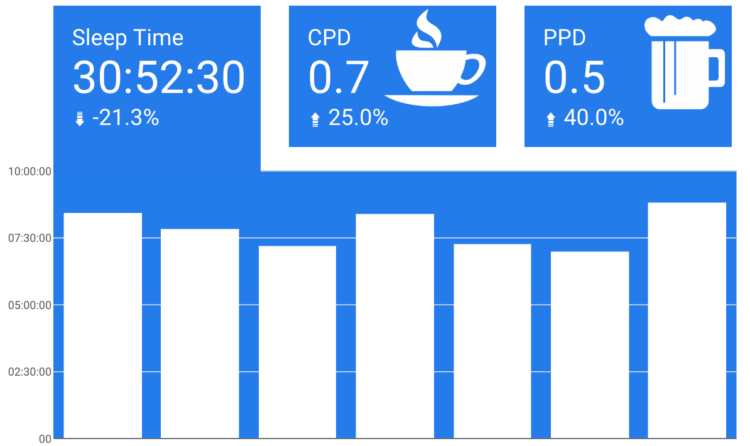
What are we looking at here? It’s a Google Data Studio report with:
- Sleep time recorded with Fitbit
- Cups (of coffee) per day (CPD) recorded with Google Analytics
- Pints per day (PPD) recorded with Google Analytics
Right now some of you are thinking, “Aren’t there apps for this stuff?” Yes, there are. And they are likely better than what I created. And you should likely use them. But this post is not about those apps. It’s about the (admittedly cool) way I hacked Google Assistant, Google Analytics and Google Data Studio to gamify my life. If you find that cool, too, here’s how I did it.
Recording Sleep Time with Fitbit
I can’t take any credit for this one. Damion at Data Runs Deep wrote a great post on getting Fitbit data into Google Analytics. You should definitely read the full article, but here is the summary:
- IFTTT recipes push data from Fitbit to Google Analytics.
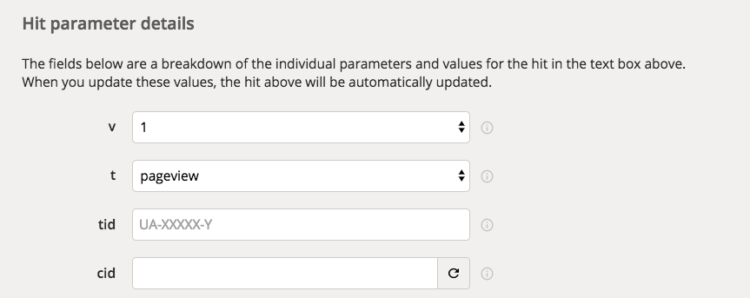
- Maker Webhooks create a GA hits using Measurement Protocol.
- Custom Metrics in GA give you clean reports.
That sounds like a lot, and it definitely took a few minutes, but it’s much easier than it sounds. Tons of credit goes to Damion’s post for perfectly outlining the steps.
Recording Other Things with Google Assistant
What things would you like to do more often? What would you like to do less often? What would you like to monitor for later analysis? Here’s my list for inspiration.
- Monitor sleep to better understand how much I need to feel rested, especially during weeks with a lot of exercise or, more commonly, craft beer sampling.
- Monitor caffeine to learn how that affects my sleep.
- Be healthier by running more often.
- Be a better son by calling home more often.
I started by creating buttons on my personal website that used Event Tracking to record Events in Google Analytics. That took about 30 minutes from start to finish on my WordPress site that uses GTM.
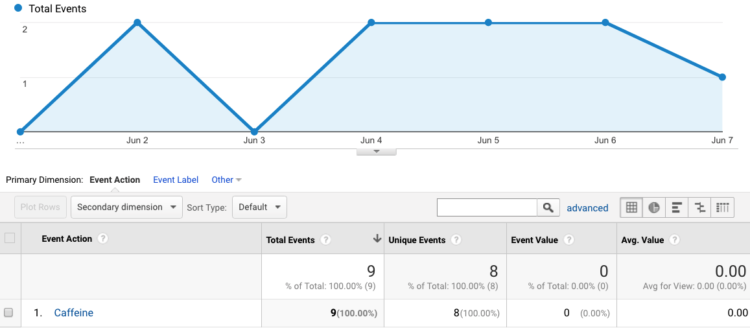
But that wasn’t enough for me.
Fat-finger syndrome on my mobile phone caused occasional tracking issues and, frankly, it was not easy enough. I couldn’t (legally) record coffee consumption while driving or (physically) record exercise while running. It needed to be more convenient for me.
Enter Miss Cleo, which is what I call my Google Assistant.
Using the Maker Webhook again, I found a SMS (text message) applet in IFTTT that, when sent a specific phrase, records the activity in Google Analytics. That number is saved in my phone as “Google Analytics” so I can use the Google Assistant to text it. Here’s a visual.
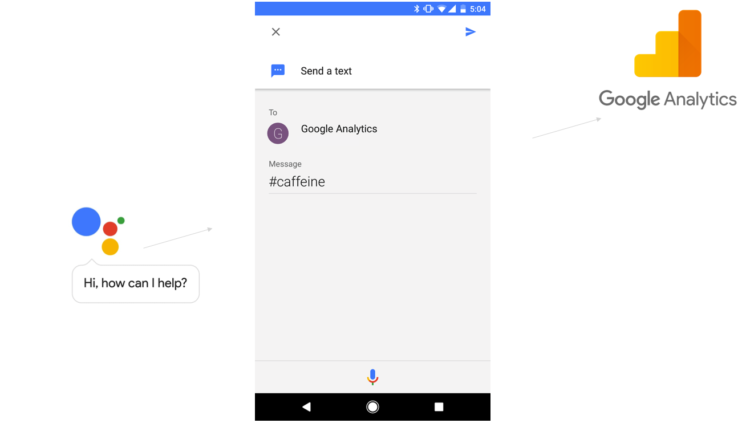
So, the steps to record an activity are:
- Cue Google Assistant by saying “Okay, Google” (while driving or running, even)
- Say “Send a text to Google Analytics”
- Use your code word as the message
- Go back to living your life while Google Analytics records your activity
Remember, you will still need to use the Measurement Protocol to get the data into Google Analytics. Reread Damion’s article and click on the following image to visit the Hit Builder.
Visualizing Your Life in Data Studio
This is the easiest part since Data Studio natively integrates with Google Analytics. Once the data is in there, it’s easy to visualize.
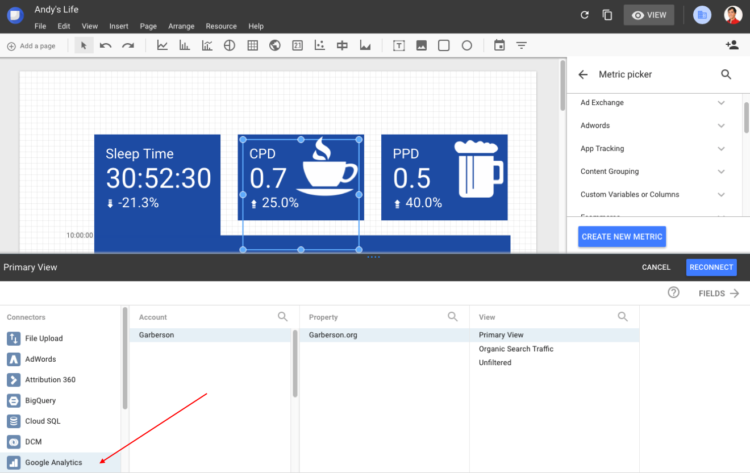
The first step is simply connecting the data source, which for me is Google Analytics. It’s worth pointing out, however, that this information can be pulled from a variety of places, including Google Sheets.
Once the data source is selected, choose your metric. For me, CPD stood for “Cups per day” which is how I quantified caffeine intake.
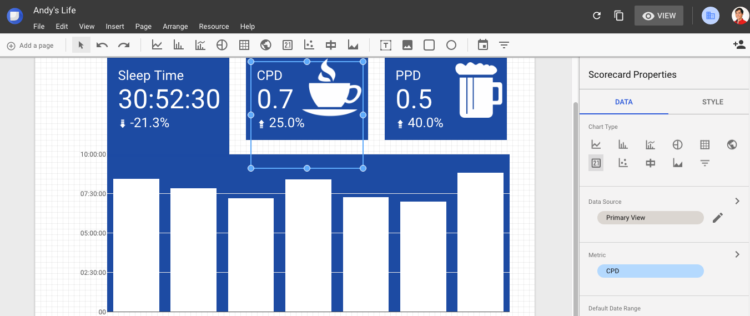
This might sound overwhelming if you are new to Data Studio. Don’t be intimidated. It is a user-friendly tool, especially if you don’t consider yourself a techie. To get you started, here are some really helpful resources from people (smarter than me!) at Bounteous.
- Introduction to Data Studio Reporting
- Data Connectors and Data Sources in Data Studio
- Developing a Data Studio Reporting Strategy
- Free Data Studio Report
- Data Studio Training
This project was used in a session at SMX Advanced in 2017. You can find the deck on Slideshare below.
Have I inspired you to run more or drink less or call your mother occasionally? Please share your progress and hacks in the comments.


