Cohort Analysis for Content in Data Studio
January 22, 2018
|
With our Data Studio report, you can answer questions like:
- For recent blog posts, which ones had more views in their first week? First month? First 3 months?
- Over the entire year, what blog post had the best start? The best long-haul performance?
- How did a specific post trend over that time? Did it start with a bang and fade quickly, or did it have a few spikes (maybe due to promoting or viral linking)?
To answer these questions, you’ll interact with the data in our report. You’ll use the blog post’s publication date, plus how many times it was viewed in the first weeks or months after it was published.
Read more about this report and how to use it here.
Instructions
1. Update Your Site Using Jon's Blog Post
Create four new custom dimensions and collect the data per Jon's instructions.
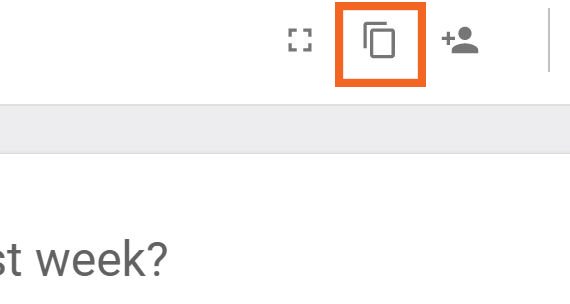
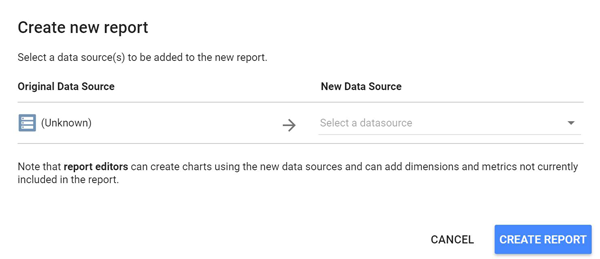
2. Make a Copy
3. Link the New Data Sources to Your Own GA Views

And that’s it! The report should populate with data from your linked sources.


