Call‑To‑Action Sequence Reporting In Google Analytics
It seems like a simple question: “What actions do users take on our site that influences whether they convert?” Unfortunately, anyone who has ever tried to get to the bottom of this in Google Analytics may have realized the difficulty in answering this question.
Built-in reporting on pageviews and interactions begins to scratch the surface, but ordering the data chronologically or drilling down to specific scenarios can be difficult. Especially at scale. Examining how on-site interactions work together on your site can be valuable in a lot of cases. Especially for lead generations sites or for companies that invest heavily in UX. Knowing when users click and knowing the exact outcome helps demystify the user journey.
For example, let’s say a user clicks on a few calls-to-action before converting. How can determine the most recent CTA click before conversion? Better yet which was the first?
For our example, let’s say you have dozens of calls-to-action that take users throughout your site, eventually landing them on a page where they can convert – like a form page. For prep work, let’s also say that you have expertly cataloged and tracked all these CTAs as events (way to go, you) in the following fashion:
- Event Category: CTA Click
- Event Action: Page Location (e.g. header, footer, in-article, sidebar, etc.)
- Event Label: Button Text
There are several “out of the box” options for learning more about how users click these links but most don’t tell the whole story or rely on tools outside of GA. Some of the options include:
- If you’re using BigQuery, you can write a quick query to get all relevant event data with session ID and a timestamp. This is perfect for passing the data into other tools for analysis, but if you want to visualize the most common CTA Click paths, this solution takes some advanced cleaning and processing.
- We could do a sequential custom segments to look for users who had multiple CTA Click events and who converted, but this oversimplifies a big question. You will only see paths for the specific sequences you create.
- We could look at events flow report, but sampling is rampant and we and these reports are oriented to the beginning of a session rather than the end – i.e. first touch rather than last.
- You could even store the most recent CTA Click event as a custom dimension, but even this will only gives you data about the last click in any session (i.e. last-click attribution) – regardless of whether the user converted.
If you want clean, easy-to-analyze data on how users interact with CTAs on your site, a little custom Google Tag Manager work is required. The following solution is inspired by the Top Conversion Paths report in Google Analytics. Our goal is to get the same visibility into same-session CTA clicks as we get with multi-channel cross session data in Google Analytics.
Custom Solution of CTA Attribution
To do this, we are going to follow a simple pattern:
- Every time someone clicks one of our CTAs, store data about that click in a continually-growing cookie.
- When they convert (only when we care to see button clicks) we will grab the data and store in a session-level custom dimension.
Ready? Let’s go!
You can start anywhere in Google Tag Manager, let’s start with what we want to happen.
Store the Correct Values in a Cookie
In Google Tag Manager, we need to create and update a cookie that will store our CTA data. We’ll be using our Cookie Management Recipe, which makes it super easy to set and retrieve cookie values.
We’ll set a cookie called ctaClicks that expires after 30 minutes to replicate a typical Google Analytics session. This time may vary based on you site traffic or how people use your site. Make sure it lasts at least as long as your session timeout.
<script type="text/javascript">
dataLayer.push({
  'event': 'setCookie',
  'attributes': {
    'cookieName': 'ctaClicks',
    'cookieValue': {{JS - Iterate Value}},
    'cookieDomain': {{Page Hostname}},
    'cookiePath': '/',
    'cookieExpires': .02
  }
});
</script>
This Custom HTML Tag will need to be attached to every Call-To-Action on your site, ideally using the same Triggers that you’re using to track events into Google Analytics.
Keep Track of the CTA Click Values
The JS – Iterate Value variable looks to see if our cookie has already been set, and adds additional button clicks to the cookie value:
function() {
  var click = {{Click URL}} + '|' + {{Click Text}};
  var currentVal = {{Cookie - CTA Clicks}};

  return (currentVal == undefined) ? click : currentVal + ',' +  click;
}
The GTM variables in our iterator variable are simply the variables we would use in our event tracking – Page location (header, sidebar, etc.) and button text in this example.
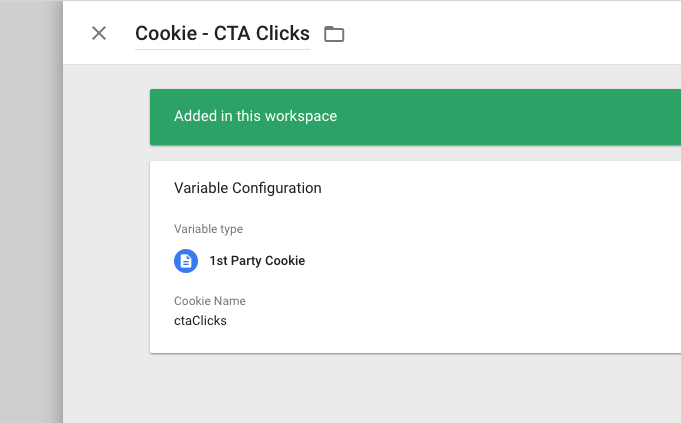
The {{Cookie - CTA Clicks}} variable is just the value of the cookie when the event occurs. We can create this with GTM’s First Party Cookie variable.
Just like that, we have a cookie that updates with every CTA click throughout a session.
Header|Request a Consultation;In-Article|Let’s Talk!;Header|Request a Consultation
I prefer to pretty-up the value a bit using a another quick JavaScript variable, let’s call this JS - CTA Path Clean:
function() {
  var cookie = {{Cookie - CTA Clicks}};
  var cdValue = cookie.replace(/,/g, " > ").replace(/\|/g, ", ");
  return cdValue;
}
This will change the value to:
Header, Request a Consultation > In-Article, Let’s Talk! > Header, Request a Consultation
This also helps the value look a little more like the Top Conversion Paths report that this solution is modeled after.
Add CTA Info To Conversion Tag
Now, all we have left to do is grab the value and set it in a session-level custom dimension when a user converts. To do this, we can use the same JS - CTA Path Clean variable used above. Using the cookie value, it would look something like this:

And Now… We Report
Now that we have clean dimension reporting on all of our top CTA paths, it’s time to report! There are a couple ways to do this in GA. We can use a custom report, or we can simply apply a secondary dimension.
Whichever route you choose, this has the potential to a LONG dimension. Depending in how it looks in GA, it may be easier to review in Excel.
Custom Reports
To make a custom report for this dimension, just go to Customizations > Custom reports. Choose your new custom dimension in the dimensions. As for metrics, feel free to get creative. Just remember to consider scoping. This is a session scoped custom dimension. I good place to start might be conversions, percent new users, avg. session duration and pages per session. This will tell you how different CTA click paths affect engagement.
Secondary Dimension
This data is also great for supplementing your standard reports. For example, what if we want to know how CTA clicks vary by traffic source. Just add CTA Clicks as a secondary dimension to your source/medium report. Do paths vary by device? Just head over to your mobile reports and snap on custom dimension. You get the idea.
What’s Next?
If your read through the entire post (welcome to the conclusion!), you can see we are just scratching the surface for the potential of a dimension like this. You should be asking questions like: Can we create a metric for count of CTAs clicks (we can)? Can we predict the likelihood of a particular CTA early in the visit (we can)? Congratulations, you’ve cracked opened the door and seen a sliver of light. It’s your choice where to go next.