Custom Features In Google Analytics For Your Website

Let’s chat about customization.
Google Analytics has many great features right out of the box, like telling you which pages are the most visited, how people got to your site, and how long they stayed there, but what else can we do? The word “custom” is all over Google Analytics, so let’s dive into a few of these customizations and see how we can even combine a few features to really make Google Analytics a powerful tool for your organization.
Custom Alerts
Most of us don’t live in Google Analytics all day as part of our job. It is normally one of the many hats we wear in our organizations. This begs the question – how do we know if something big happened on our site and we don’t know fast enough?
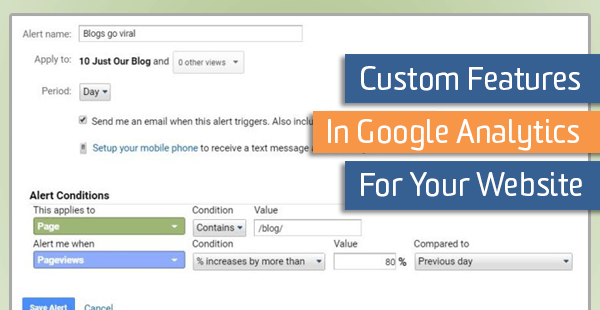
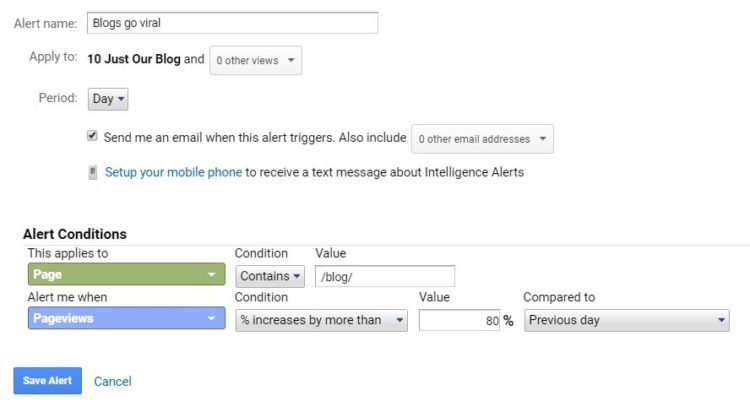
Let’s say your tracking breaks and you stop receiving data. How would you know? The opposite could also happen. What if your company is mentioned somewhere and you get a sudden spike in traffic and have a viral post? Well, there’s a tool for that, and it’s called custom alerts.
Unfortunately, you can’t just tell Google Analytics to “notify me when something goes viral” or “notify me if everything breaks.” We need to define these situations in terms of Google Analytics data first. So, how do we want to define when something goes viral? How about a percentage increase in traffic day-over-day or week-over-week?
A similar approach would work for “notify me if everything breaks,” but instead we would look for a decrease in traffic by 100% day-over-day.

Custom Dimensions
Custom Dimensions are probably my favorite thing to use in Google Analytics. Yes, there’s so much we can do with Google Analytics right out of the box, but no one knows your business needs like you do. With that in mind, are there pieces of information you wish you had about your site, interactions that take place, or the users that visit?
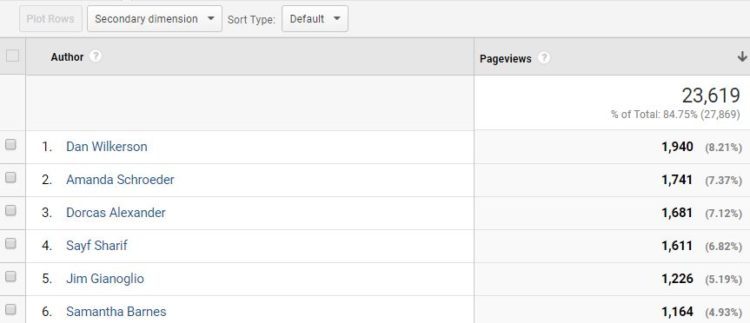
Here’s an example: would you like to see which one of your authors get the most traffic to their publications on your site? Let’s set a hit-based custom dimension for Author and find out!
Looking at interactions, we can set hit-based custom dimensions for form fields to get more out of your event tracking. You could send the selections that users make on the forms that you have on your site! Custom Dimensions can also be set to describe a user, like what type of account status they have on your site. The sky’s the limit! (as long as there isn’t any Personally Identifiable Information, PII, in your data, that is).
I have mentioned hit-based and user-describing pieces of information, but there are other options, referred to as the “scope” of the dimension. Emily’s blog below is a great introduction to Scope in GA!
Understanding Scope in Google Analytics Reporting
By: Emily Rosche
Published: November 30, 2016
Scope can be set to hit, session, user, or product. Here are some short examples of how to use each scope:
- Hit: passed with one-time interactions, like the author of a page or a selection of a form.
- Session: describes the overall visit to the site, like where the user came from, or whether or not they were logged in.
- User: Describes a person over multiple visits and all the events within. This could be their membership status or the company they work for.
- Product: This is for eCommerce implementations, and can be used for product color, size, variant, and more.
Want some more ideas on what to do with Custom Dimensions? Check out this post for more!
Custom Metrics
Custom metrics can also be sent to Google Analytics based on things that happen on your site. There are different scopes and formats that need to be set within Google Analytics to make sure that the reports make sense for your data.
Your scope will either be hit-based or product-based, and your format will be set as an integer, currency, or time. The most common implementations I see with custom metrics are things like video plays, impression counts for a banner on a site, or the number of items/checkboxes selected on a form.
Do not let these examples limit your creativity! Below is a blog post by Dorcas Alexander on an advanced implementation for custom metrics. In this post, Dorcas explains how to count the number of times a particular selection was submitted on a form:
By: Dorcas Alexander
Published: July 14, 2016
Put Them Together with Custom Reports
Custom reports are commonly used to simplify the default reports that are available in Google Analytics, but these features truly shine when you use Custom Dimensions and Metrics with them.
By: Dorcas Alexander
Published: August 10, 2015
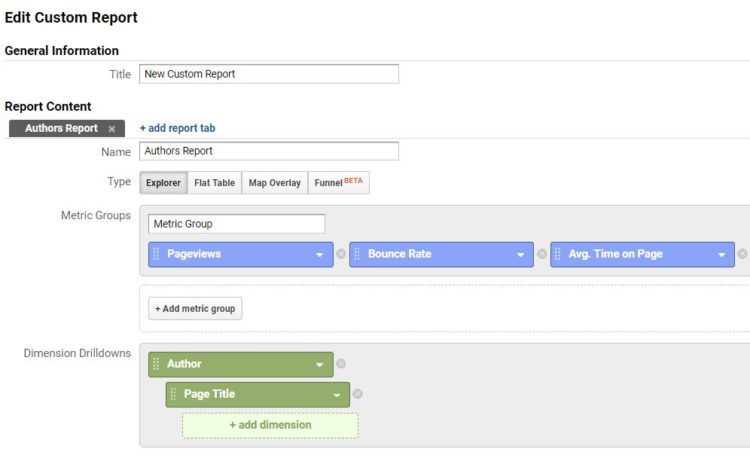
When I work with publishing sites, I always set up a Custom Explorer Report that starts with Author, then has Page Title nested below. This will let you compare all the authors with associated pageview metrics, then let you click on an author’s name to see all the pages they wrote and see the metrics broken apart by each page. You can also add custom metrics to these reports, like ad-impressions, video plays, and downloads, if you are recording those metrics.


Happy reporting!


