Improve Google Lighthouse Audit Scores For Drupal Sites

Whether you’re building a new site or monitoring an existing site, understanding how your website performs is crucial. However, it can be challenging to clearly define what “website performance” means to you and your company. Ask around and you might get a hundred different answers on what’s most important and how to measure it.
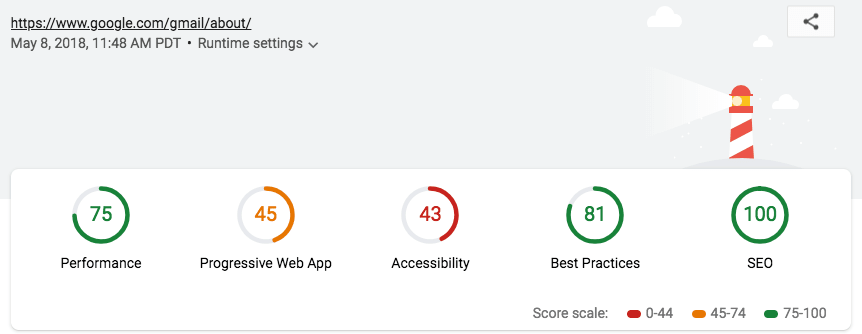
Luckily for us, Google created a resource called Lighthouse to help define top areas to monitor and a method for quantifying performance in those domains, with scores in each category out of 100. This open-source audit tool helps identify key improvements to be made across several domains. Running a Google Lighthouse audit can be a great tool in your arsenal, helping to improve the customer experience, address accessibility issues, practice SEO best practices, or even improve your page speed.
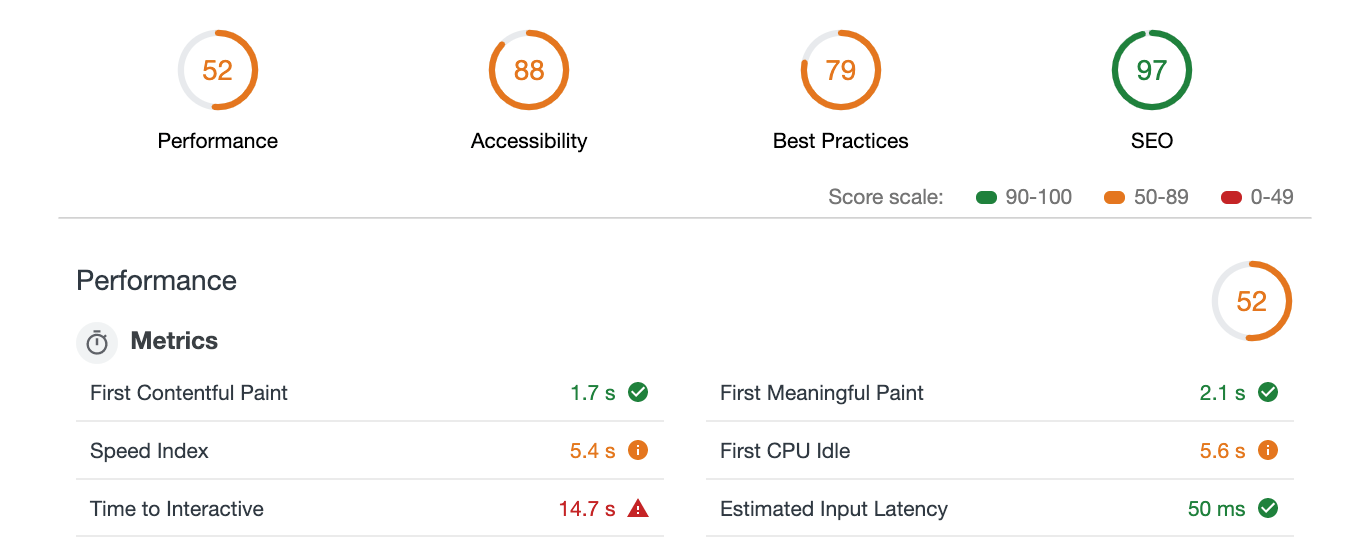
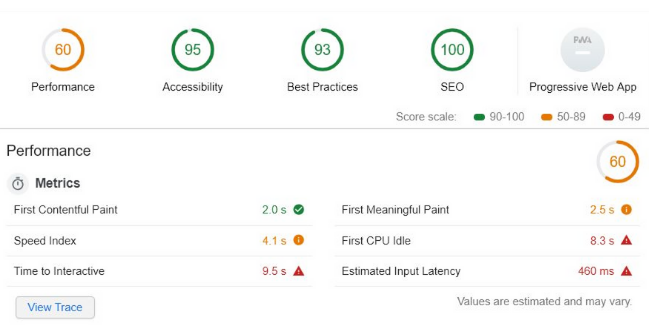
We tried the Performance grade out on our own site, built on Drupal 8. When we saw our score was a not-so-glamorous 60, we knew we had work to do. To ensure we practice what we preach — or pick your metaphor: cobbler’s kids, a contractor’s walls, drinking our own champagne, etc. — one of our 2019 Hackathon teams spent their time testing and tinkering to improve our scores.
Now our trials and tribulations are your learning opportunities! Let’s dive into the discoveries we made, solutions we found, and how to get started improving your own Google Lighthouse score.
What is Lighthouse?
Google Lighthouse is an audit tool that reports on site performance and site speed. Scores are assigned from 0 to 100.
A score of 50 represents the 75th percentile, and a perfect score of 100 represents the 98th percentile, which is the point of diminishing returns. Scores are weighted based on a variety of factors. The Performance score, for example, is a weighted average of a dozen or so Performance audits.
Why Do Lighthouse Scores Matter?
By using Lighthouse scores as a guide when building a site, your code will be better by informing you of next-generation formats, new techniques, and tools you may not know about. To focus on a specific test, the Performance category is a crucial — fixing the identified issues help address how long it takes your page to load or to become usable to the visitor. Page speed is important for a number of reasons; it’s an SEO ranking factor, a faster site is more accessible for regions that rely on mobile devices, and speeding up your page can positively affect conversion rates.
As an added benefit, it also provides your audience with the best possible experience by being usable to all (accessibility) and faster (performance). The report feels like a code review, however, it’s not an opinion or terribly subjective. It gives you hard facts, pointing out where your site needs improvement.
Where to Start?
It can be overwhelming and hard to know where to begin. First and foremost, you will want to understand how to use Lighthouse. We particularly liked these resources, both provided by Google: How to Run Lighthouse and Lighthouse Scoring Guide.
We’ve collected a series of Pro-tips below for anyone considering Lighthouse-inspired website improvements, followed by specific technical changes geared towards Drupal development.
Pro-tip 1: Focus on High-Impact Pages
We recommend looking at the top 10 highest trafficked pages on your site. Your Google Analytics Top Pages report is a great place to pull this information, and focusing on the top pages will ensure you have the most impact on your audience.
Take a look at the top pages on your site and check to see if they are using the same layout and functionality. If so, we'd recommend picking just one of those pages and then select another popular traffic page to focus on IF that is using a different layout. This will help you provide recommendations for improvement that are not page specific, but rather site wide and reusable.
Pro-tip 2: Baseline Your Site’s Lighthouse Scores
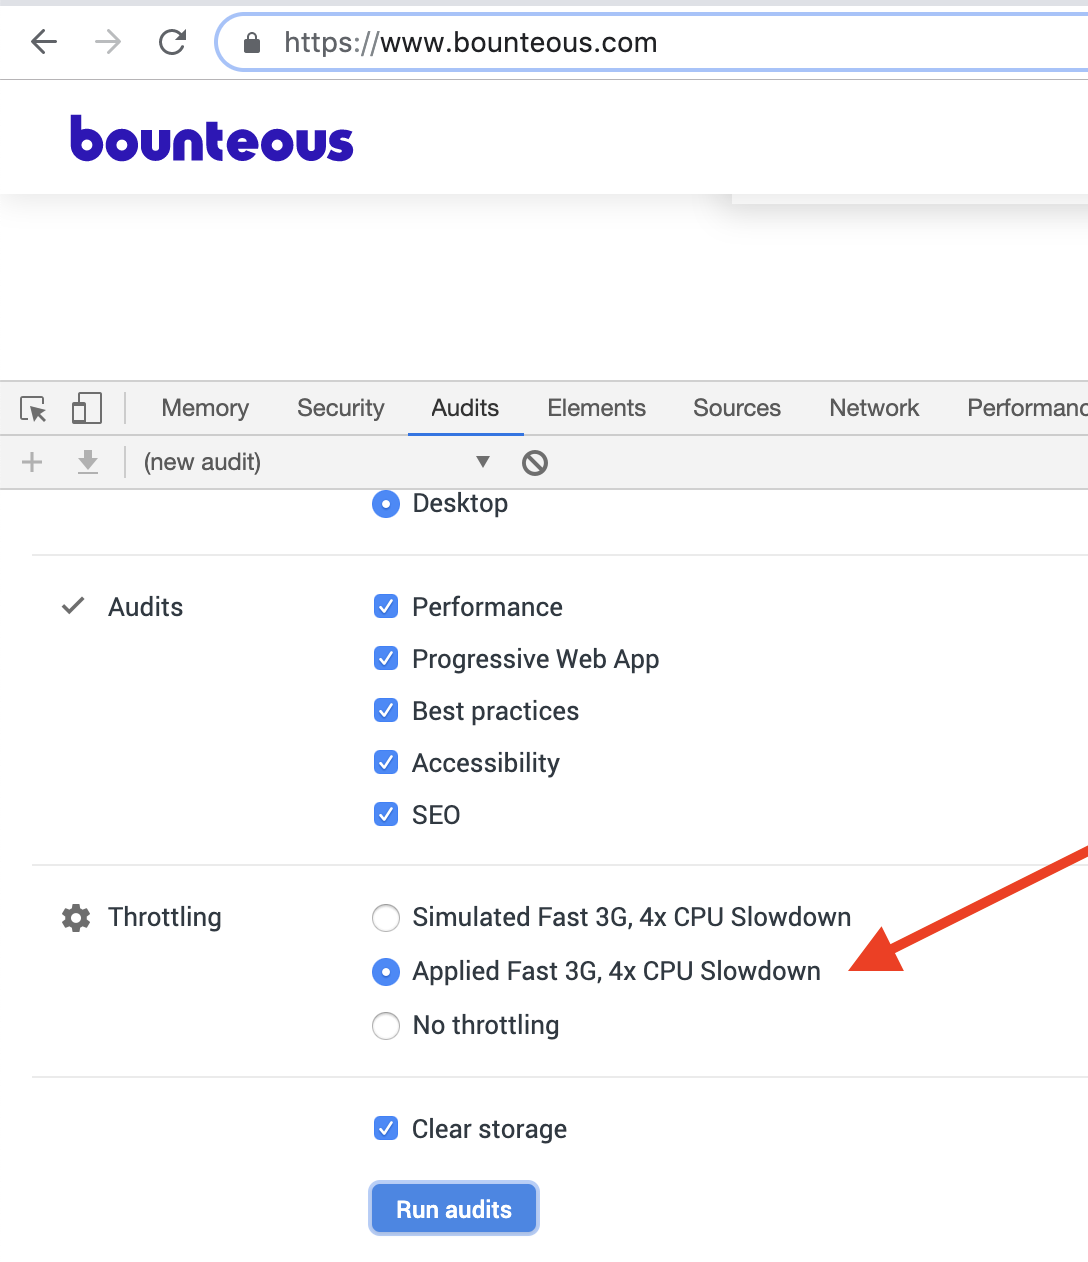
Now that you are familiar with Lighthouse and have targeted the pages you wish to impact, you will want to baseline each page’s Lighthouse score. We found it most helpful to baseline the “worst case” scenario by selecting the “Throttling / Applied Fast 3G, 4x CPU Slowdown.”
Run the audit (or generate a new audit by clicking the “+” button), and save your Lighthouse reports as JSON. To do this, click the “Download Reports” button in the Audit toolbar. It’s also possible to use automation to export reports as a Gist from the CLI version of Lighthouse on Github.
It’s important to save these reports so that any updates made to the site can be re-audited and compared to previous versions. You can simply save them in your project’s folder or use a shared drive like Dropbox or Google Drive.
If you’re also using Drupal, Andrew Olson presented a recommendation at his 2019 DrupalCon talk, Audit Your Theme, suggesting that you save reports (along with other site metrics) in your Drupal theme directory. Regardless of where you store your reports, you will need to use the Lighthouse Viewer to easily look at previous scores.
Pro-tip 3: Resolve Severe Issues First
We recommend focusing on the most severe issues listed in the results. These issues are listed in red within the report. By resolving the severe issues first, we found that most of the secondary issues (listed in an orange color) were also resolved. Make sure to rerun your report each time. Our advice is to wash, rinse, and repeat.
Lighthouse Audit Usual Suspects
Run a few Lighthouse audits and you are sure to see some trends. To highlight those, we audited Drupal.org, since the Bounteous.com site is built using Drupal.
The audit provides a list of opportunities to improve overall scores. As an example, here is the list from Drupal.org:
Expand the section on “Serve images in next-gen formats,” and you will find specific recommendations. In this example, Lighthouse recommends image formats like JPEG 2000, JPEG XR, and WebP. These formats often provide better compression than a typical PNG or JPEG. Better compression means faster downloads and less data consumption. That translates to better Lighthouse scores, in addition to a faster mobile experience where everyone wins.
Other usual suspects include:
- Eliminating render blocking resources that block the first paint of your page. A solution may be delivering critical JS/CSS inline and deferring all non-critical JS/styles.
- Defer offscreen images by lazy-loading offscreen and hidden images after all critical resources have finished loading to lower time to interactive.
- Enable text compression (gzip, deflate, or brotli) to minimize total network bytes.
- Minify JavaScript files to reduce payload sizes and script parse time.
- Serve properly sized images to save cellular data on mobile devices and improve load time.
Lighthouse Audit Recommendations for Drupal Websites
For our Hackathon team, we were tasked with learning more about Lighthouse and implementing the suggested opportunities to improve our scores. We tackled this on our site, but many of our findings will be applicable to other websites, whether they’re built on Drupal (like ours) or on other websites.
For those unaware, Drupal is an open-source platform for web content management that is easy to use and scale. It currently powers nearly 2 million websites worldwide, including a few beautiful sites that we particularly enjoy.
We learned a ton in the process making discoveries along the way on solutions we could use to fix our own issues and about the overall Lighthouse functionality.
Finding 1: Lighthouse Audit Scores Can Fluctuate
Don’t expect to get the same Lighthouse scores from your Production environment as you will get on your Local or Development environments. Your scores will vary due to outside factors such as:
- Network activity
- CPU
- Load on Server
- Minified CSS/JS
We suggest you baseline both your Development and Production environments. This way when you test your theories in Development, you can understand how your improvements are impacting the overall score in context. Don’t forget upon release of your iterative improvements to rerun Lighthouse in Production as your final record of results so you can trend over time.
Finding 2: Properly Optimize Your Images
Life lesson: Don’t use original images.
Drupal 8 now includes the Image and Responsive Images modules as part of the “core” set of modules. These allow uploaded assets to be resized to their viewing size, but the default setting is to use the "original image." By setting up "image styles" for the views and blocks for the site, it allows content creators to upload large files, and have them served up in a variety of sizes (thumbnail, banner, 2x, etc.) with zero effort.
Used in conjunction with the Responsive Images module, users will only receive the image that best fits their display. The following guides, Setting Up an Image Style and Responsive Images in Drupal 8, are excellent to get you moving in the right direction.
Now that the images are being sized appropriately, we can use more modern image compression formats to shrink their size even further. The next generation file formats that modern browsers support, specifically WebP, is truly impressive. We took a 659 KB PNG file and were able to reduce it down to 29 KB! That is 1/22nd the size, or about 4.5 percent of the original! JPEGs also compressed from 309 KB to 182 KB. However, there was a little “softness” to the WebP version of the image compared to the original photo, but the savings in bandwidth and the decrease in time to first view outweigh the minor quality loss. It’s worth exploring because the new image formats can reduce your file sizes by as much as 90 percent.
The WebP module for Drupal 8 also has a nice trick up its sleeve. The .htaccess file can be updated to check if the browser requesting the image supports WebP in addition to confirming if there is an existing WebP asset available. With this in place, you can now serve up the WebP data and MIME type instead of the original JPEG or PNG. This means that there is no new code to write for your templates, and no detection via JavaScript. Unfortunately, WebP is only supported by Edge, Firefox, Chrome, and Opera. JPEG 2000 (JP2) will need to be set up for Safari support, and JPEG XR for IE 9, 10, and 11.
Finally, you want to make sure that your images are served at the proper size at all viewports. Lighthouse reduces your score if you display an image whose actual aspect ratio size is larger than the size it’s viewed in our browser. You will want to work closely with your design team to understand the ideal image sizes at your different breakpoints. Then you can take those viewports and configure your Responsive Images module to give you the best results for high-resolution devices.
Finding 3: Take Website Accessibility Seriously
Lighthouse uses the Deque axe engine to collect Accessibility recommendations for you to implement into your site. Accessibility is important to Bounteous and we focus on improvement. Within our Lighthouse report, we found a few quick wins that helped us attain the ever-elusive 100 percent Accessibility score for one of our targeted pages.
The improvement that pushed us to the 100 percent score involved adjusting our SVG files. Yes, you heard me correct. A simple SVG update. No, we did not unwind and rewrite our entire menu system to be tab friendly. No, we did not feel strangely compelled to add ARIA attributes all over the place to earn this score. Sometimes following the rules can pay off!
Our site has SVGs files embedded within our HTML. The result of adding them embedded within the page was causing malformed HTML due to repeating IDs within the SVG. Per rule WCAG 4.1.1, there should be one (and only one!) ID per page. While it was a simple fix, we were curious why multiple IDs can be a big deal for Accessibility. And this leads us to a great side-benefit of checking your site with Lighthouse. You will learn tons about how to do things “the right way,” which leads to expanding your site’s audience and reach.
A few additional challenges you may run across is implementing Accessibility solutions for your third-party tools. In our case, we use the module Disqus for our blog. Scroll down a bit and you will see it on what you are reading right now! A few of the accessibility recommendations proved a bit more challenging to implement.
Third-party widgets can be great, you get all the benefits of not having to code or maintain the solution yourself. However, the downside is that you don’t have control over the actual implementation to make improvements. While our recommendations were not insurmountable, they were not simple or completely within our control. But it’s also a great opportunity to give back to the Drupal community by contributing fixes to this module.
Finding 4: Anticipate User Behavior
Not-so-fun-fact: The more images you have on your page, the lower your Lighthouse score. Try telling Marketing you want to get rid of all your images! You can help your situation by only loading images that are necessary to the user as they scroll down the page. Using lazy loading on elements only when they are needed can solve this issue and improve your score.
Due to the limited amount of time we had for the Hackathon, we didn’t get to fully implement and test drive the Drupal module Lazy Load which uses the Blazy library. After reading a bit more about the module and library, we found that it would have been ideal to start out building our site with this module rather than adding this approach later.
Our recommendation is to install the module when first creating components and anticipate images coming into the page to optimize your user’s experience. Looking ahead, we will aim to use this module as we add new components. This way, we can learn more about how Lazy Load behaves one component at a time and then slowly work towards implementing lazy-load into all of our components based on our learnings along the way.
Finding 5: Quick Fixes = Big Impact
With Drupal's default .htaccess file:
<IfModule mod_expires.c>
  # Enable expirations.
  ExpiresActive On
  # Cache all files for 2 weeks after access (A).
  ExpiresDefault A1209600
  # Do not cache dynamically generated pages.
  ExpiresByType text/html A1
</IfModule>
Static assets will only be cached for 14 days. Typically, these static assets are images referenced by your theme/CSS. Although a short cache may be preferred when your site first launches, should changes be needed, it’s inefficient for both your users and the server. The ExpiresDefault should be increased to a full year (ExpiresDefault A31536000).
This was a very easy way to increase our Lighthouse score, but it just scratches the surface of having an efficient cache policy. For ways to fully leverage cache on your server check out, Cache-Control.
Finding 6: Your Mileage May Vary
Not all suggestions by the report are realistic or accurate. For example, we received a suggested “Opportunity” from the Lighthouse report that implementing a solution would save us five seconds of page load time. Upon implementing the suggested opportunity, we only received a 1-2 second improvement.
Some recommendations may impact other internal people or processes, and aren’t just a technical fix. As always, before implementing a suggestion or testing a tool, take the time to understand the investment needed and consider if the results are worth the effort.
Look to the Google Lighthouse
Before:
After:
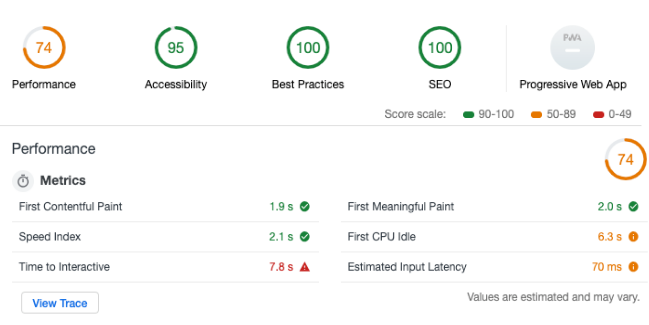
The first step to solving a problem is admitting you have one. We noticed our score wasn’t the greatest Lighthouse Score at 60 percent and went about finding solutions to change this. We have already started implementing some of the above items and have seen our score improve.
It’s important to keep in mind that Lighthouse Scores can fluctuate for a number of reasons, so checking in regularly is an important part of upkeep and maintenance. So far the above items are working really nice on our site, improving our site experience and ultimately our Lighthouse scores. It’s never a once and done process, so keep in mind that your website will always need continued testing and tinkering as you strive to keep your Lighthouse score moving on up!
