Bringing Numbers into the Picture: Insight‑Driven Design
Insights are as much a part of design as colors or drop-down menus. By bringing in data, observations, patterns, and more, we create an experience informed by quantitative insights as much as design best practices.
We view insights as ideas that incorporate multiple lenses – quantitative research, big data, qualitative research, business goals, and KPIs – and focus on what best applies to a particular challenge. For example, data might tell you that people are abandoning their shopping cart two-thirds of the way through checkout. But while that data is important for identifying an area of focus, it doesn’t hand us the solution.
At that point, adding in qualitative research can help you understand why the behavior is happening. While quantitative data (like cart abandonment) focuses the research, qualitative user observation allows you to witness the cart-abandonment issue in practice. The combination of data and observation can help reveal and develop insights that address the friction points.
Let’s further explore how quantitative and qualitative come together to reveal design insights.
Data from Day One
You might keep a cheatsheet of design best practices on your desk or have certain guiding principles committed to memory. For example, designers know that when items are spatially grouped together, users interpret those items as being related to each other in some way. This knowledge can be used in designs to achieve positive outcomes and avoid negative ones.
Most of these general design principles would be classified as qualitative insights, but it’s worth remembering that nearly all of them are based on published, psychological findings and statistically significant studies. Dive into a design best practice, and you’ll find that the foundation for qualitative is often quantitative. Every design decision we make is built on a foundation of data.
Whether you’re working on a full-scale design or redesign, or looking for incremental improvement to an existing process or design, data can help inform, guide, and influence your exploration and design ideas. It’s important for teams to work together to determine what information they already have available, and it's also important what information they may need or would be helpful to support design recommendations or monitor performance.
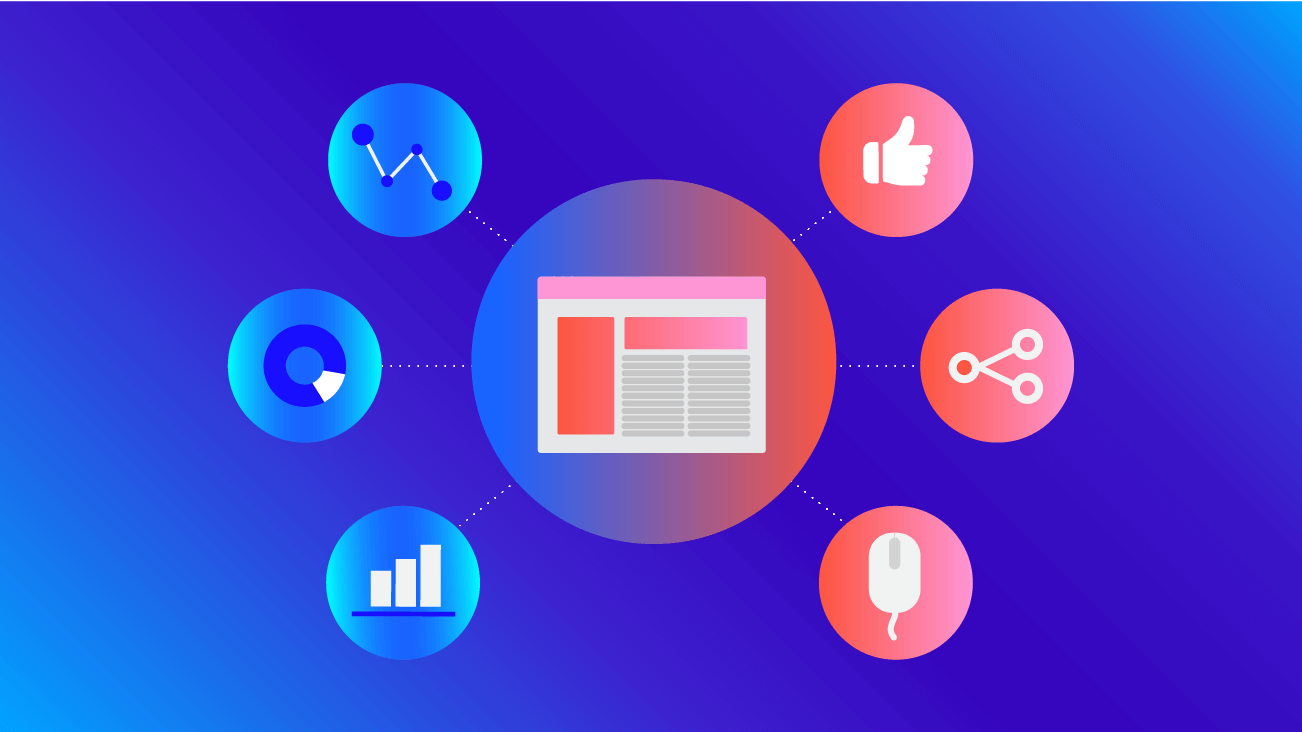
There are many tools out there to help track and measure interactions with websites and mobile apps — we’re particularly fond of Google Analytics and Adobe Analytics. Most people know they should have “website analytics” — but depending on one’s familiarity with the tools, they might not know the full potential of website measurement.
To get the most out of a tool like Google Analytics, extra effort is needed to track additional site interactions like downloads, video plays, navigational clicks, scrolling, and more. Custom information about a site’s users, content, and marketing efforts can and should be captured. Additionally, you can set up measurement in Analytics for the things that matter most, like specific goals or eCommerce, to help measure the effectiveness of marketing efforts.
Not everything on your site needs to be tracked, but planning ahead and creating a strategy around measurement on your sites and apps will help both identify problems that might be happening, like cart abandonment, and prove the success of your design efforts.
Informing the Design Process with Qualitative Research
Before even kicking off the design process, we can turn on our listening ears and inform our project goals and challenges by using a number of qualitative tools designed to extract insight from disparate sources. Data, research, and evaluation are tools that can and should be used throughout all stages of the design process — not just at the beginning or the end.
We’ve talked before about the value of the user experience discovery, highlighting a few of the tactics that you can pull from to inform your design process. Incorporating research from stakeholder interviews, comparative reviews, unmoderated and moderated testing, and surveys can help inform the design process, while making sure your recommendations are tied to important goals and KPIs.
Vetting Your New Design with User Testing
Most user testing happens on a small scale (fewer than 30 users) and is useful for identifying notable shortcomings in a design. We should leave these tests with a clear idea of what big-picture changes should be implemented.
Consider a test where six out of 10 people successfully complete a task, and the remaining four do not. While it is true that 60 percent of users succeeded at the task, it is misleading to present a 60 percent success rate as a finding. The sample of users is too small and the margin between success and failure is too narrow to make statistical inferences from these results.
In the case of this type of test, the goal is not quantitative findings. Instead, an appropriate conclusion would be that four people struggled to complete the task. This qualitative observation indicates that there are areas in need of improvement, and identifies where designs may require revision.
Additional qualitative data can be collected through participant surveys, focus groups, and user interviews, which lead to further insights in the design process. Creating a proper testing protocol is key for leading consistent testing initiatives.
Using Statistics to Test and Optimize Design
A/B tests and other quantitative tests of statistical significance provide the tools we need to refine and optimize a design. These tests rely on a large sample of users (more than 30), selected at random, to show that a design decision and a desired outcome are correlated to one another. In other words, we can use data (and some math) to make the case that a design and a behavior have a relationship.
Ideally, the designs being tested present small differences so that the takeaways are focused and there is a clear path toward optimal user outcomes. These types of quantitative insights are incredibly powerful. Not only can they answer a specific design question, they can become the basis for new best practices and guiding principles.
There are many tools that help make this process easier, both by setting up the test and calculating the winners using statistical models: Google Optimize, Adobe Target, or Acquia Lift are examples of tools that can support A/B testing, multivariate tests, redirect tests, and personalization. While an A/B test should never be the sole determining factor, the data you collect can help inform a new round of revisions, confirm or reject certain assumptions, and add extra weight to your recommendations.
Advanced Data Science to Complement Design
From basic website analytics to advanced data science techniques, insight can be derived from a number of sources. While not every company or customer has access to the volume of data or the in-house capabilities necessary for this type of analysis, we particularly love the opportunity to combine our internal disciplines to deliver better designs. With a foundation of quality data collection, we can analyze large amounts of data to help identify critical areas for improvement or confirm the success of particular designs. We love to break out advanced techniques like principal component analysis, audience modeling, or segmentation drawing on them to help us understand variations of user behaviors, what's working and what's not, and the impact of certain site features or content on success.
If you've started with that base foundation of "Data from Day One" — you'll be in a great place when you get the chance to employ some of the more advanced data techniques. As tools become cheaper and easier to use, like Google Cloud's Machine Learning Engine, terms like machine learning, artificial intelligence, and modeling are no longer relegated to startups and tech companies. This type of analysis won't necessarily tell you all the answers, but when you add in expert interpretation, design best practices, and the other tools you've used, you'll have a powerful collection of insights to draw from.
Quantitative and Qualitative Data for Better User Experiences
Being aware of how research, data, and design intersect can help build better user experiences. With so many ways to collect data and information, the challenge quickly shifts to strategy, process, and people. Take time to learn what your company's capabilities are, what you may need to add to your arsenal, or how other departments may be able to contribute. From our experience, collaborating with our design, analytics, and data science teams to incorporate data-driven findings has helped us build a powerful, insight-driven process — not to mention better designs.