Using Custom Dimensions & Metrics to Maximize Your Commerce Reporting

Google Analytics commerce reporting is necessary and vital to making important decisions concerning your online marketplace presence. Right out of the box, you’re able to see Transactions, Revenue, Products Purchased, Conversion percent, etc. based on dataLayer values on your Thank You/Order Confirmation page.
Enhanced Ecommerce takes it a step further by adding in more dimensions and metrics for analysis along the way. Depending on the level of implementation (and level of effort vs. development cost), we’re able to see the performance of additional metrics for Purchases/Refunds, Cart Additions/Removal, Product Details, Internal Promotion Clicks, Views, Impressions, and much more. All of this information is amazing and wonderful, but there are many facets to online transactions that can come into play in which Google Analytics (GA) and Enhanced Ecommerce do not inherently account for.
Custom Metrics & Dimensions
If Google Analytics doesn’t automatically account for all of our unique reporting needs, what can be done? That’s where Custom Metrics and Dimensions come in! Standard Google Analytics allows you to create up to 20 Custom Metrics and Dimensions per Property. If you are a Google Analytics 360 (GA360) user, that number gets bumped up to 200 each, and that’s a lot of reporting potential!
**Remember: Once created, custom metrics and dimensions cannot be deleted—only disabled or repurposed.
When working with custom dimensions and metrics, it’s especially important to be mindful of scope within GA reporting; or how GA defines and categorizes your data. Each dimension and metric may only be assigned one of four scope types:
- User scope: Relates to user attributes & data across the lifetime of the user instance.
- Session scope: Attributes of an entire session, and is limited to session length.
- Note: User and Session Scope applies only to Dimensions.
- Hit scope: Attributes of a single hit, and are the most granular level.
- Product data: Attributes of a single commerce hit for a product.
The appropriate scope for your custom metrics and/or dimensions will depend on their intended reporting use. We’ll recommend scopes to go with the examples below, but for more detailed information regarding GA Scope, our own Emily Rosche wrote a fantastic post, Understanding Scope In Google Analytics Reporting.
What Makes Your Checkout Process Unique?
This is really the main point of this blog, isn’t it? Here are a few potential metrics and dimensions that can be implemented to offer additional insights right from your GA user interface (UI).
Potential Metrics
Custom metrics are just what their name implies—metrics that are not inherent in GA reportings. Similar to custom dimensions in GA, a little extra work needs to be done in the GA interface by adding the metrics to your GA Property Admin Settings and via the Universal Analytics code or Google Tag Manager & data layer variables. We’ve outlined the custom metric implementation steps in further detail here.
Here are some real-world examples of how these could be used:
Rewards/Points Accrual - Hit Scope
Certain businesses have initiatives that allow their User Accounts to accrue points that can then be applied towards purchases. Once users have enough points, they can redeem them during checkout. It is still a transaction, but GA will not recognize this as new revenue.
Gift Card Redemption - Hit Scope
Similar to a Points Redemption, when users apply gift cards to their purchase, GA will interpret this as a transaction. You can create a custom metric for transactions where points or a gift card is redeemed.
As an example, a transaction could have a total revenue of $50 but the user applied a $25 gift card. With a combination of a custom metric for Gift Card revenue and a calculated metric for Actual Revenue (Revenue - Gift Card Redemption), this transaction is now trackable
Subscriber or Revenue Churn - Product Scope
If you are running a subscription-based revenue model, customer retention is imperative. A KPI to help us measure this is “churn rate.” This is the rate at which subscribers (or revenue) is lost. In order to report on this figure in a meaningful way, we need to define a consistent time frame—I prefer a month over month view.
To calculate this rate, we will need to know the number of Total Subscribers at the beginning of the month and the subscriptions lost during this time. Finding ways to reduce your churn rate will immediately improve your monthly revenue figures.
Value of Cart - Hit Scope
With Enhanced Ecommerce, you can see metrics like Add to Carts, Remove from Carts, Cart Abandon counts and percentages. But with the addition of a Cart Value Custom Metric, you can see the value of unpurchased items in user’s carts. A segment can be created and used to remarket to these high-value, potential customers in Google Ads.
Potential Dimensions
Segmenting and analyzing the different experiences of your User types with custom dimensions can also provide insights about mission-critical data that would otherwise be lost into the ether. Here are a few examples that we have found to be useful over the years:
User ID - User Scope
One huge benefit to implementing a User ID (not to be confused with a Client ID), is the fact that you can begin accurately tracking the same user across different devices, provided that they are logged in. With this information, you can demonstrate which devices operate better in terms of user acquisition vs. conversion. For instance, some users might like browsing products on their mobile devices but ultimately feel more comfortable making a purchase on a desktop (also a great opportunity to outline potential user experience (UX) improvements by device category.
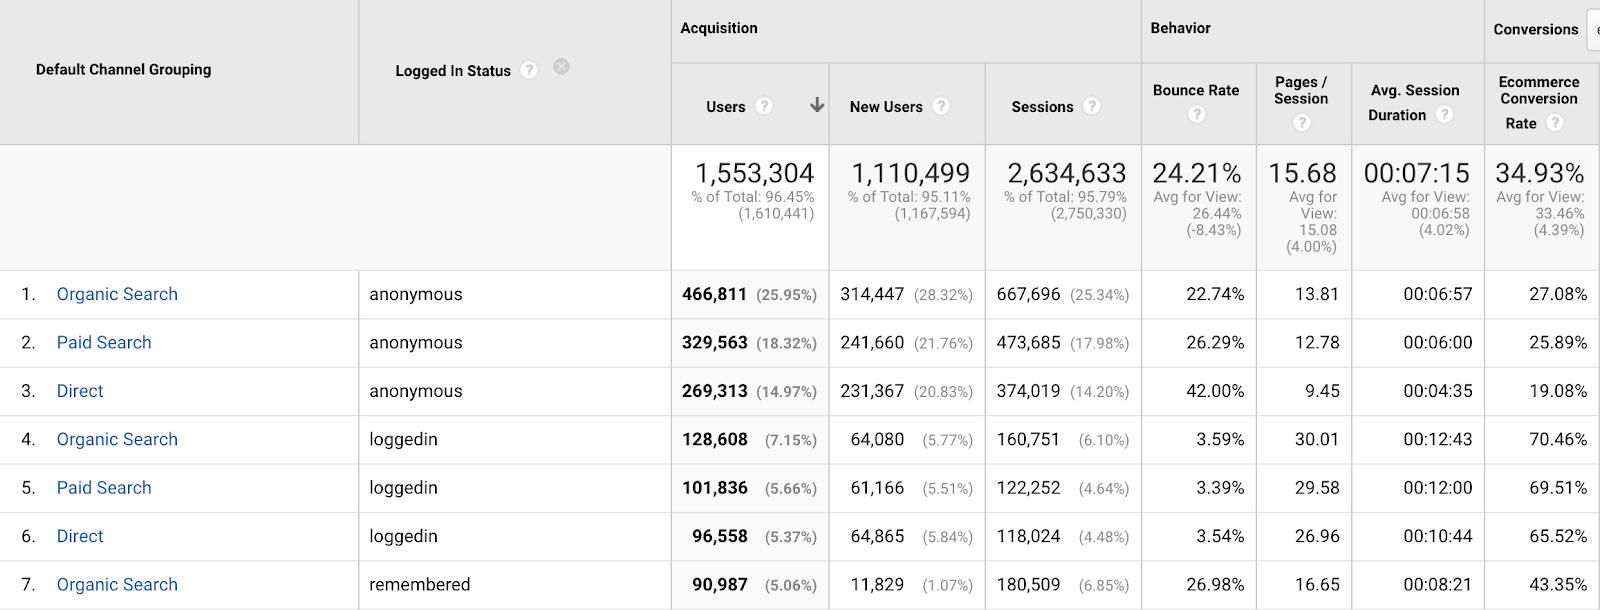
Logged in Status - Session Scope
This one can help you understand the journey and preferences of logged-in users. Such as, do they differ from Users who are not logged in? Are there benefits to logging in or staying logged in like having access to gated content, premium features, etc.?
User account type - User Scope
Some websites provide different levels of service/features based on the type of account a user can create (e.g. Basic, Premium, Free, etc.) or the payment frequency (charged monthly vs. annually).
Items in Cart - Product Scope
Similar to Value of Cart, you can create a segment and remarket to users that have a certain number of items in their cart to prompt them to buy (e.g. free shipping on multiple items).
Stock Status - Product Scope
Commerce websites that have products that are very popular and sell quickly, or in from different locations, might find it valuable to know when products are in stock or out of stock when they are searched for.
Manufacturer - Product Scope
Many wholesale and B2B retail websites contain hundreds or thousands of individual products from potentially as many manufacturers. This Product scoped dimension will allow tracking for the sales performance of individual manufacturers across their product lines.
Shipping Weight - Product Scope
For sites that sell and ship larger, heavy items like tires, aftermarket vehicle parts, workout equipment, literally anything heavy; shipping and freight costs become a major consideration. Begin to analyze trends in average shipping weight/Transaction and explore avenues to optimize your business.
Purchase Type - Session Scope
For content publishers, you may want to keep track of different purchase types like a one-time purchase or an ongoing subscription. This is great to help project future revenue, but it can also serve as a gauge to measure any efforts aimed at turning those one-time purchases into recurring revenue from subscriptions.
Product Category Variants - Product Scope
Commerce tracking in Google Analytics already accounts for Product Category, but if you would like to, you are able to segment your data similar to Content Groupings without being limited to five categories. For instance, let’s say you’re an online retailer with many departments/product categories. You could potentially have multiple drill-down levels for analysis starting with the Category of “Appliances & Housewares,” which can further be subdivided depending on the product’s use.
- Appliances & Housewares > Kitchen > Refrigerators
- Appliances & Housewares > Bathroom > Bath Towels
- Appliances & Housewares > Bedroom > Alarm Clocks
- And so on...
Payment Type - Hit Scope
If your site offers multiple, popular payment methods; analyze the UX metrics to see if certain payment types lend themselves to quicker transaction process (logging in through a third-party like PayPal) or splitting up purchases over time with a financing option. This data could be used to determine if some payment types are being underutilized, or need to be reevaluated.
- Example payment types: Credit Card, Paypal, Finance, Gift Card, Coupon, Rewards, etc.
Tailor Your Analysis
Now that we have the ability to create and utilize custom dimensions and metrics, we can further tailor your analysis with Calculated Metrics. To learn a little more, Veranika Haurylovich just wrote a great article about Calculating the Average Product Page Views Before Actual Conversion. How do you plan on using them in your commerce reports? Does this have you thinking about new dimensions and metrics specific to your business?


