Using Debug Mode and _satellite.logger in Adobe Launch

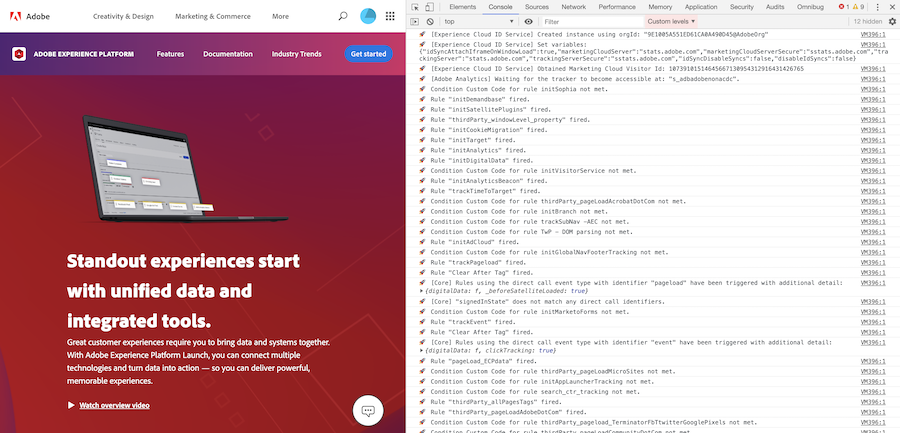
Learning to use debug mode is essential to working in or with Adobe Launch. Debug mode allows you to see what Launch is doing in the background of your site once it's loaded. With debug mode enabled, you are able to see what rules fired or didn’t fire, what extensions were loaded, and other important configuration information which can help you identify possible bugs and errors.
You can find more information on debug mode output via the Launch marketing page on Adobe.com.
There are two ways to enable and disable debug mode — a console command and an extension. To toggle debug mode via the Javascript console, open your developer tools, and paste one of the following commands:
Enable debug mode:
Disable debug mode:
setDebug is a function of the _satellite object that takes a boolean (true/false) to enable or disable debug mode. Once you enter this command and refresh the page, you will see the logs in the console indicating that you have enabled debug mode.
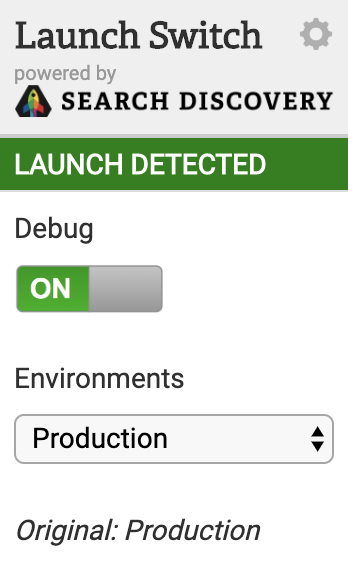
If you’re working with Launch, odds are you are familiar with the Launch Switch Chrome extension. Through this extension, you can enable debug mode simply by toggling it on in the extension view:
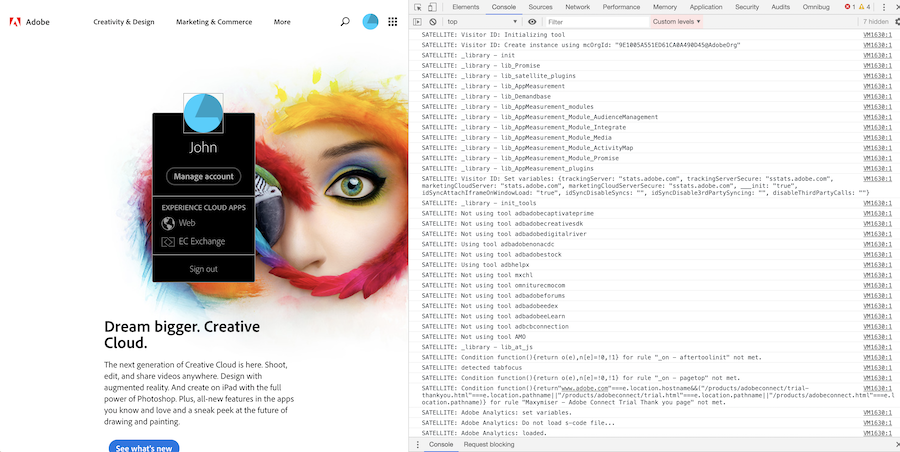
You can quickly tell if a website is loading Dynamic Tag Manager (DTM) or Launch based on its debug output. If the console logs have the rocket emoji 🚀, then it’s using Launch. If the logs are prepended with “SATELLITE:”, then the site is loading DTM. Debug mode can be enabled on any site loading DTM or Launch. You do not have to be a user in the property.
In the example below, you can see the Adobe.com homepage loads DTM, as indicated by the logs visible in debug mode.
Using the Satellite Logger
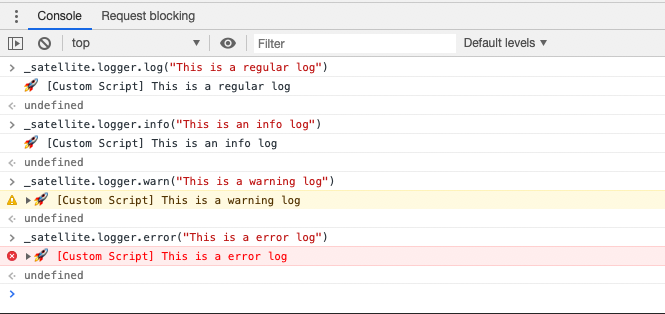
There are four types of logger methods you can use to send messages that you can output to the console. This allows you to tailor the type of log to the content of the message.
- Log
- Info
- Warn
- Error
These may look similar to Javascript’s native logging methods, and that’s because the satellite logger is based on Javascript’s logging methods and performs the exact same way.
Satellite.logger replaces DTM’s _satellite.notify method, which only allowed for log/info level messages (no warning or error formatting). In fact, if you try to use _satellite.notify in Launch, you will get a _satellite.warn formatted message telling you that notify has been deprecated and that you should be using the logger.
Filtering in Debug Mode
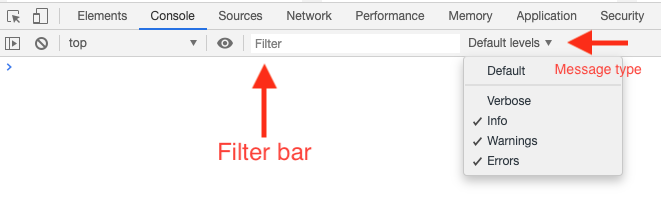
When working with debug mode, it’s important to know how to effectively filter the javascript console. This will allow you to find your logs faster and/or only view messages of a certain type. You can use the filter bar to search logs by content and the levels dropdown to filter logs by type. When I am writing logs for myself, I like to throw in an identifier that I can easily filter or that will stick out in the console (such as “******” in the logs above).
Why Custom Logs in Debug Mode Matter
More important than how to log your own custom logs in debug mode is why. You can probably think of a unique way to use this functionality for yourself. Let’s look at a couple of the main reasons you should be using custom logs.
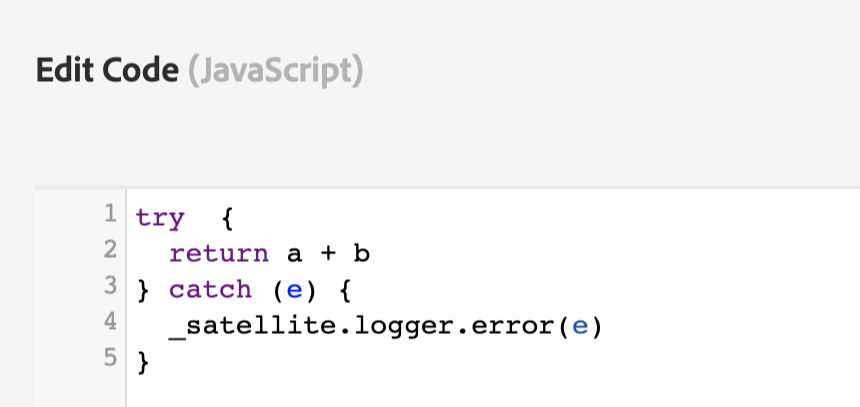
Log Errors from Try/Catch Functions
Custom logs are a great place to log errors you identify from try/catch functions in custom code. I err on the side of wrapping my custom code in try/catch blocks and using the logger in conjunction, making sure any errors identified don’t clog up the console for other users.
Some invalid Javascript (undefined variables):
This error will only show when debug mode is enabled and will not break the page in any way:
Double Checking The Data
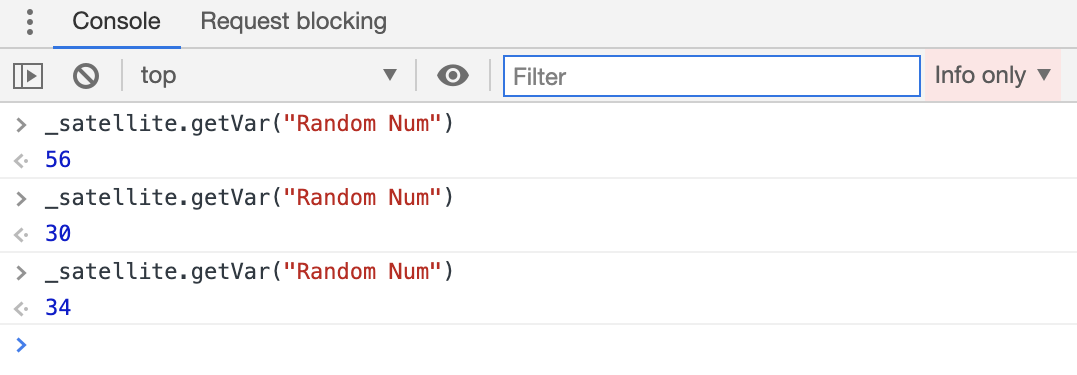
Custom logs are a great way to double-check the data you’re working with. Instead of having to do the extra step of typing _satellite.getVar(varname) in the console to check the value of a data element, you can just log it with the _satellite.logger function in a rule. That way the data is already there in the console for you to find.
Custom logging code in a rule (the data element returns a random number between 0-99):
This log will only show when debug mode is enabled:
An interesting side note here — the random number data element type is a function that will return a different value each time it’s called. So, if you were to use this in your application in some capacity and then tried to check the value in the console, you would get different values.
The exact same thing could be done with regular console logs, but using the satellite logger adds an extra layer of safety between your code and outputting directly to the console. Again, _satellite.logger messages will only be seen in the Javascript console when debug mode is enabled.
Debug Implementations More Deliberately and Effectively
Now that you know how to enable debug mode, you’re able to see what Launch is doing in the background of your page. With this information, you will gain valuable insight into what you’re loading on the page and the data that is being sent. Additionally, using the satellite logger, you can write your own custom messages that are only visible in debug mode, allowing you to debug your implementations more deliberately and effectively.
