Leveraging Google Analytics for Small Business

Are you a small business owner or nonprofit organization looking for new ways to make better business decisions?
More often than not, small businesses and nonprofits have limited budgets and resources to devote to marketing initiatives. As the business owner, you may already be wearing multiple hats—accounting, human resources, inventory management, or even marketing!
By using tools like Google Analytics, which are free and easy to use, you’ll be able to answer questions you may not have previously been able to, using features that’ll aid in driving insights. Is your target market visiting the site pages you want? Why do mobile users leave faster than desktop users? Did your social media campaign drive more traffic on Facebook than the one on Instagram?
If this is your first time hearing about or working with Google Analytics, don’t worry! There’s a wide library of resources that will assist you with the initial set up of Google Analytics on your business or organization's site.
After you implement Google Analytics, you can focus on a few key reports to find quick wins for your small business or nonprofit. Google Analytics features four different reports to view and employ: Audience, Acquisition, Behavior, and Conversion. Along with these reports, you also have the ability to create custom segments in order to drive additional insights from your site data and visitors.
Now, let’s get into some quick wins you can achieve by using each Google Analytics report!
Audience Reports in Google Analytics
Audience Reports provide insight about your site visitors—age, location, device type, and more. Questions that could be answered using this report include: Are visitors coming from a particular location that we’re not currently reaching in our marketing efforts? Or, how do mobile visitors use our site differently than desktop visitors? There are two reports that will help you answer these questions: Geo > Location and Mobile > Overview reports.
Location Reports
Geo > Location
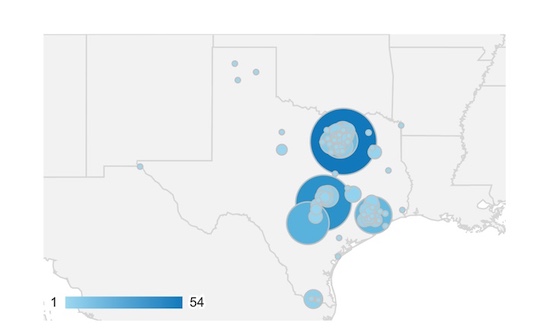
The location report shows you where your visitors are located geographically, which can give small business owners and nonprofits insights to help solve business problems. This report can be drilled down by country, region, city, and metro. Are you a nonprofit that has offerings for certain communities, or a small business trying to reach local neighborhoods? This is a great go-to report to ensure you are reaching the right people and locations.
Mobile Overview Reports
Mobile > Overview
Have you ever wondered what kind of devices result in the most time spent on your website, or even just new and returning visitors? Duration and new user are two examples of metrics in the Mobile Overview report that can be used to measure performance within the Device Category dimension. For every breakdown of dimensions on the reports, we will have the same set of metrics to view as well. If you see that mobile is underperforming compared to desktop, then you may want to revisit the user experience for mobile devices in order to increase the overall success for mobile visitors.
Custom Segments
If you want to learn even more about your site visitors, check out our blog on creating custom segments within Google Analytics to draw greater insights on user interactions.
Acquisition Reports in Google Analytics
Acquisition reports provide insights into how your visitors discovered your website. This is useful to see if your campaigns are bringing in the desired traffic or metrics for campaigns and initiatives. If you spend advertising money on Google Ads or other platforms for campaigns such as social campaigns or PPC (pay-per-click), this is where all of that data is aggregated. The ones I will be highlighting will be Campaigns > All Campaigns and All Traffic > Source Medium.
Campaign Reports
Campaigns > All Campaigns
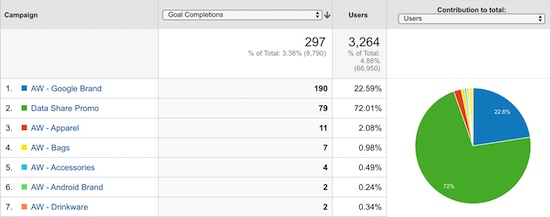
All Campaigns report is a way for you to see how your campaigns are performing, which are broken out by the different platforms you’re using. For example, the breakdown might include campaigns from Google Ads, promotions sent via email, or even campaigns created through social media platforms. This report is useful for commerce websites in order to see revenue brought in through specific campaigns, or successful goal completions for any business or organization.
Traffic Source Report
All Traffic > Source/Medium
Traffic Source reports show you the source and medium between all site visitors. Source data will show you everything pertaining to where they were coming from—Facebook, Yahoo, Google, or even third-party sites. Then we have Medium, which buckets the sources into how they got to your website, for example, from direct, organic, referral, or social.
Google Analytics will only be able to show you defaults on source and medium, unless you have campaign tagging setup—such as linking your Google Ads campaigns to Google Analytics. Again, this is extremely helpful to draw insights on how effective social media, email, ads, or even newsletter campaigns are, or how visitors are finding your site.
Want to link your Google Ads campaigns to Google Analytics for additional insights? Check out these resources on linking Ads to Google Analytics, or tracking inbound campaign links.
Google Analytics Behavior Reports
The Behavior Report is where you’ll be able to see how your site visitors interact with your website. Are they visiting the pages you want them to? Are they adding items to cart, but not completing the purchase? By looking into Site Content and Events > Pages we’re able to answer these questions.
Reports on Site Content
The All Pages report shows performance across your pages, but here's why the Landing and Exit Pages reports are specifically important. Landing Pages and Exit Pages reports give insight into what page your user visited to enter your site and the last page they visited before they left.
Pro tip: make sure to pay attention to important landing pages outside of your homepage in order to keep site visitors engaged with your website. A common question you may run into is why certain pages have higher % Exits or Bounce Rates compared to others?
Are certain blog posts performing better than others? Are certain steps of the checkout process resulting in a high amount of cart abandonment? If you have these questions, this is the report for you. If you’re seeing underperformance on specific pages, you’ll want to work on the site design—especially for pages that are vital towards your organization's operation such as online sales, donations, or even applications.
Search Terms Report
Site Search > Search Terms
The Search Terms report is able to provide you information on what your visitors might be looking for once they are on your website. This does require a few additional steps in terms of set up and implementation in order to get this data, but this will be vital in discovering the search terms your potential customers are using. Is there a trend in the searches coming in that might be useful to address a need—new products or services to include? Here are some articles that will assist you in both the implementation and the utilization of site search:
Google Tag Manager
Lets briefly touch on another Google Marketing Platform product, Google Tag Manager (GTM).
Within Google Analytics, the data coming in is all based on the user’s site interactions—what site pages are they visiting and how long are they staying on certain pages, as a couple of examples. If we want to know more about which buttons are being clicked, or if we want to see how many people didn’t submit an inquiry; we highly recommend using GTM to gain these additional insights.
Check out these resources to assist you in setting up GTM and implementing tags for event tracking on your website:
Conversions Reports in Google Analytics
Conversion reports provide insights on which of your sites visitors converted to complete a goal or can provide data on completed purchases for your commerce site.
Now, you may be wondering, what is a goal? A Google Analytics goal should be a business problem that is measurable and actionable. For example, of visitors to your donation page, how many of those visitors actually donated to your organization? We can measure this with goals! These are also very customizable and can be tailored to your organization. Something to keep in mind with these reports in Google Analytics, is you won't be able to view Goal or Revenue metrics until you’ve completed the custom setup.
Goal URL Reports
Goals > Goal URLs
The Goal URLs report tells us where site visitors completed the goal we put in place. For example, if you have an e-newsletter sign up in the footer of each site page, this report will be important to identify which page resulted in visitor sign-up.
Goals can even be set for site engagement to determine how many site pages a visitor explores—this would be ideal for a commerce site since visitors typically browse multiple items during a single site session. I recommend browsing the below link for additional background and details on goals in Google Analytics:
Product Performance Reports
Commerce > Product Performance
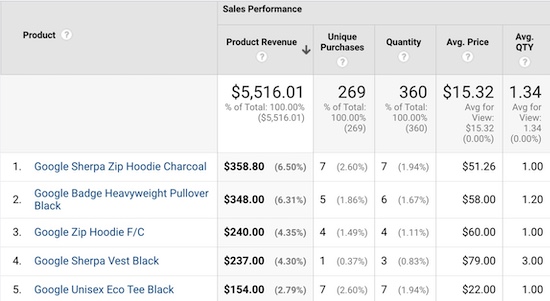
The Product Performance report can be used for any commerce website where purchases occur. This report gives you information about top-performing or underperforming products, product revenue, or even the percentage of product detail pages that resulted in a purchase. This is a great report to use to see which items to push more on advertising or social media promotions, or even what to put on sale. You can get a lot of useful data and insights by tracking order transactions and revenue.
If you have a commerce website, here is our guide to Implementing Enhanced Ecommerce.
On the other hand, we’re not always able to have a dedicated team of web developers to set up Enhanced Ecommerce. Another great alternative is adding an additional site page such as a Thank You page once the order has been completed. This is something we can then create a Google Analytics goal around, to get data for additional insights.
Start Solving Business Problems
Now that you’re familiar with the basic reports in Google Analytics, it’s time to start solving business problems! Hopefully, this introduction was able to inspire you and your team to see the possibilities Google products enable for your nonprofit or small business in order to reach new heights with analytic insights. For next steps check out the blogs below, or visit our Google Insights section which covers everything Google Marketing Platform, or find our next Google Marketing Platform training near you!
Next steps:


