Bringing Google Analytics Data Into Google Sheets

If you’re reading our blog, the chances are pretty favorable that you’ve used Google Analytics at some point. Maybe you’ve used it to check on basic metrics like overall pageviews and sessions from time to time, or maybe you’ve performed more in-depth reporting with filters, advanced segments and custom dimensions.
You’ve clicked, scrolled and explored using the date range calendar, the left navigation menu and the tables and graphs showing your data. All of this within the Google Analytics interface, because that’s where the data lives and that’s where the data stays. Right?
Not so! In this post, I’ll introduce you to a really easy method (seriously) to make automated reports completely within Google Sheets using the Google Analytics add-on. If you’ve ever caught yourself manually typing numbers into spreadsheet cells for web reporting, this is one solution to automatically get the numbers you need into your reports.
Data can be accessed outside of the web application thanks to Google Analytics’ Core Reporting API. Veterans may remember the precursor, the Magic Script, developed by Googler Nick Mihailovski in 2012 as a way to work with and automate Google Analytics reporting in Google Docs. This add-on was built on top of the script and shortens the path from opening a Google Doc spreadsheet to running a report.
Getting Started
If you’re not a programmer, don’t run away when I mention ‘API’! This does not require any coding experience. Here is what you need to create a custom spreadsheet report with your Google Analytics data:
- Access to a Google Analytics account
- A blank Google Docs spreadsheet (you can create one in your Google Drive)
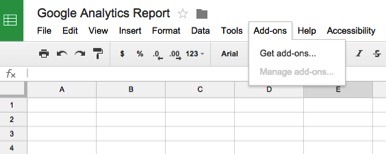
To start, open the spreadsheet. In the menu, look for the ‘Add-ons’ then select ‘Get Add-ons.’ NOTE: You have to have upgraded to the latest Google Spreadsheets, identified by a green checkmark in the lower right corner and the Add-ons menu option.

A pop-up should appear showing a lot of different add-on options. In the search bar within the pop-up, type ‘Google Analytics’ to find the one we need- it should be the first result. Now, just click the button to add it and grant Google Analytics the necessary permissions.

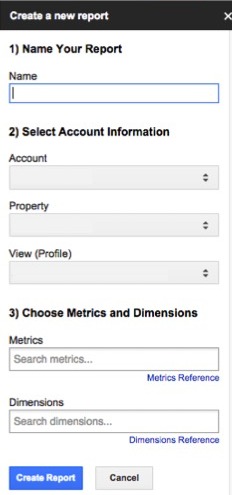
Once it is installed, you can then go to Add-ons > Google Analytics > Create Report to start your first report. A new prompt should appear on the right side of your spreadsheet.

This is where you will specify which property and view you would like to report on. You can also choose which metrics and dimensions for your first query, but everything else is optional. After clicking ‘Create Report’, your workbook should now have a sheet called ‘Report Configuration.’
You can add more reports in the columns and every report will generate a new sheet. It is generally best practice to add a sheet to act as the ‘finished product’ which references the data in the report sheets. When you select ‘Run Reports’ from the add-on menu, everything will be updated.
Metrics and dimensions need to be formatted a specific way. For example, instead of just typing ‘users’ in the cell, we need to type ‘ga:users.’ Having the reference guide open is useful to find which metric or dimension you need to use. There is even a Query Explorer widget where you can test the output of your queries before putting them in your spreadsheet.
Below are some reasons to use the add-on instead of or in addition to exporting reports from the interface:
Specific and Granular Reporting
Report on exactly what you or your department needs. No more, no less. There’s no reason to go through the interface and take more steps than needed to answer a simple monthly/quarterly/yearly question of “What is ‘x’ compared to ‘x’?”
Branding
Creating your own reports outside of Google Analytics means that you control exactly how it looks. Unlike reports from the interface, you’ll have the ability to add whatever logos, fonts and branding elements that fit within your organization.
Sharing
You can share your Google Docs spreadsheets the same way you would any Google Drive file. Whomever you share it with can view and edit the report. However, only Google accounts that have access to the corresponding analytics account can run the reports to update it.
Dashboards
If you’ve used the dashboard functionality in Google analytics, you might have noticed that there is a limit of 12 widgets. Other limitations include a homogenous date range for all widgets, a limit to how many rows or chart items can be displayed and the inability to selectively add segments. With the add-on, you can create a dashboard in Google Docs without those limits.
Work your data
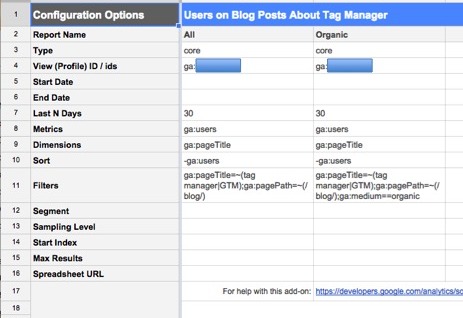
Instead of just looking at the numbers in Google Analytics, make them work for you. Having the data in a spreadsheet give you the ability to add, subtract, get percentages and use formulas to gain more specific insights. For example, you’d be able to easily answer the lengthy question, “What percentage of users who visited blog page titles containing ‘Tag Manager’ came from organic search in the last 30 days?”
An example of that configuration is below. Notice that not every field needs to be filled-in. I’m using a descending sort by users and I’ve applied two filters to my first query and three filters to my second. ‘=~’ is equal to the RegEx or contains option. So when I use ga:pageTitle=~(tag manager|GTM), this means that I am looking for page titles containing ‘tag manager’ or ‘GTM’.

It may take some time to set up, but once you have the report framework, you only need to change the date range every time you use it. For more information, check out Google’s help section offering suggestions and more detailed instructions for complicated setups.
If you are more of an Excel person, another method of report automation is available by using Shufflepoint. In any case, remember that when it comes to reporting, you are not limited to the Google Analytics web interface!


