Multi‑Channel Funnels In Google Data Studio

Where Are the Multi-Channel Funnel Metrics in Data Studio?
The Google Analytics Data Connector in Data Studio is probably the most-used out of any of the connectors available. It makes sense because it pulls in data directly from the platform without any extra steps and matches the sampling level that’s in Google Analytics (500,000 sessions for Standard and 1 million sessions for 360).
This is important; since the data comes directly from the reports, Multi-Channel Funnel (MCF) metrics and dimensions will not be included in the Data Source. As you may be familiar, the MCF reports use different data due to the different way attribution is displayed and calculated.
The Multi-Channel Funnel reports also come from a different API. This will become useful when we get to reporting. Instead of the core reporting API, it has its own. In the future, we may see a Google Analytics MCF connector or they may be folded into the core Google Analytics connector. For now, we will use a workaround.
*Data-Driven Attribution is not available from this API.
How Can I Get This Data?
Conversions have been set-up in Google Analytics and our team has a solid understanding of how the standard attribution model is different from the Multi-Channel Funnel reports. We’re ready to create a dashboard to analyze our multi-touch conversions. How many times did social sources assist in conversions? Which channel is most valuable when it is the first interaction? These are questions that cannot be answered by the standard, last non-direct, attribution Google Analytics reports.

Even though it isn’t available from the main Google Analytics connector, we can use Google Sheets to get the data we need.
Using Google Sheets with Data Studio
Configuration with the Google Analytics Add-On
If you find yourself coming across roadblocks with the Google Analytics connector such as re-aggregating metrics or combining data sources, Google Sheets is a solution. Third-party connectors are also available, but Sheets will be the free method we choose here.
It’s helpful to be familiar with using the Google Analytics add-on for Google Sheets, but that is only the first step. Similar to Data Studio, the add-on takes data from the standard, core Google Analytics data. So using MCF dimensions and metrics in the report configuration wizard will result in zero matches.
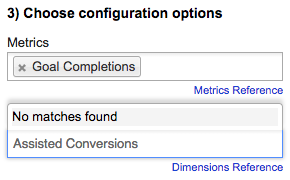
That’s okay! We can still use this method to create our report. The first step (after making sure you have the Google Analytics Add-On for Google Sheets) is to go to Add-ons > Google Analytics > Create New Report. Then, leave the “Metrics” and “Dimensions” fields blank and click the “Create Report” button.
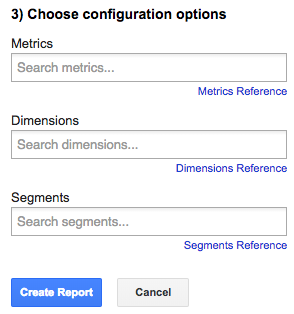
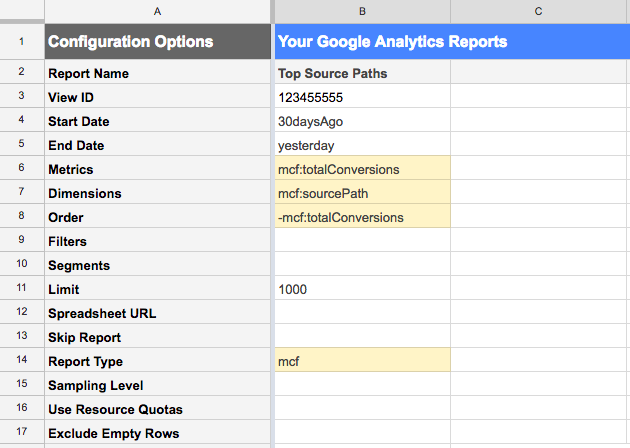
Next, go to the “Report Configuration” tab. This is the tab where all of your queries will be set-up, so this is where we will type in the Multi-Channel Funnel dimensions and metrics that are formatted according to the API. Go to the MCF API’s Dimensions and Metrics Reference to see all of the Google Analytics data that are available (notice how DCM and AdWords are included, too).
As an example, I want to show a simple report of the top source paths including all conversions. After looking at the reference, I find the correct dimension and metric that I want and add it to the named rows. To sort, I just use the same metric with a minus sign “-” to pull the query in descending order by total conversions.
Important: Expand rows 14-17 to reveal the row named “Report Type”. This is where you’ll tell Google Analytics that you’re using the MCF API, not the Core Reporting API (the dimensions and metrics that begin with “ga:”).
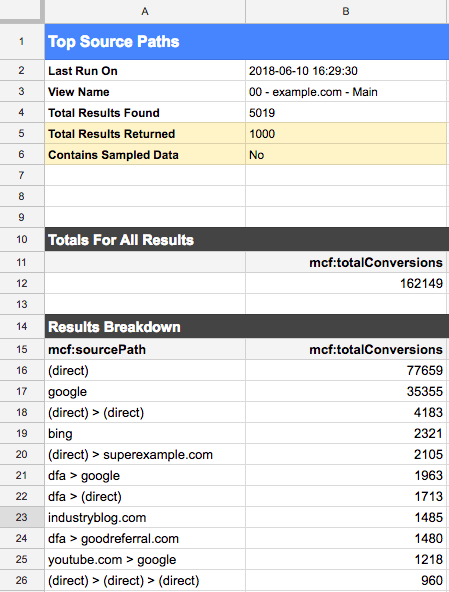
The report will generate a new tab based on the Report Name. We got what we wanted – top source paths by the total goal and/or ecommerce conversions. But wait! Always, always check your Google Analytics reports in Google Sheets to see if the data is sampled. Here, we see that the data is unsampled. This means that there are under 1 million conversions for this date range, which is the limit for the Multi-Channel Funnel reports.
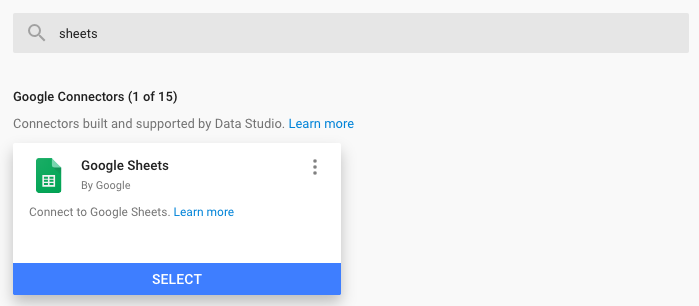
Now we’re ready to add this information to our Data Studio report. First, we’ll add a new Data Source to the report. The connector we’ll use for the data is the native Google Sheets connector displayed below:
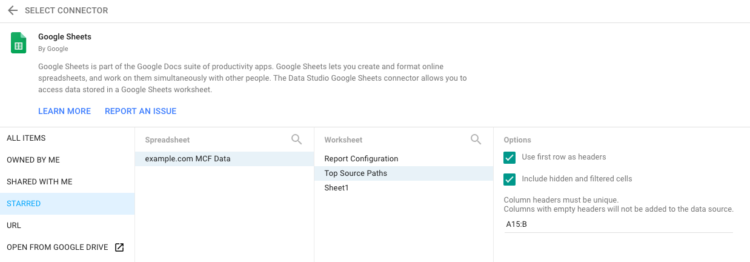
In the next window, “All Items” will show you all Google Sheets that you have access to. I starred my spreadsheet, in this case, to make it easier to find. I’ll then find the specific tab, “Top Source Paths”, where the data is located.
I’m only using a selection of the data in the “Options” panel. I’m choosing to start on A15 because that’s where the data begins in my sheet.
Great, it’s time to use the data after adding it to the report! I’m going to add a simple table with my new data source.
Tip: when you have multiple queries and tabs in Google Sheets, it is useful to have another tab with all of the data in one place.
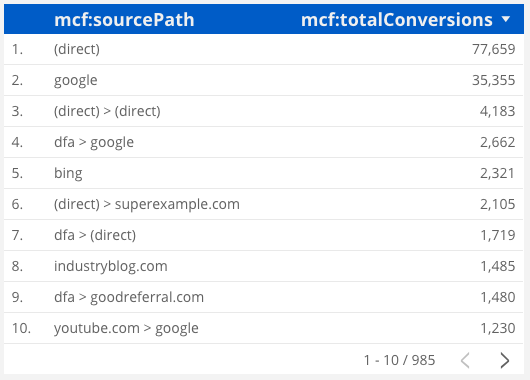
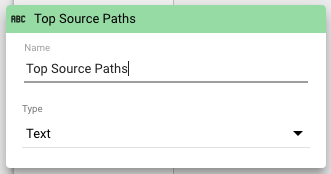
The data is useful, but those table headers are distracting. Don’t worry – field editing will help with formatting these to make them more readable. In the Data tab for the table, selecting the pen next to the dimension and metric will give you the option to rename them.
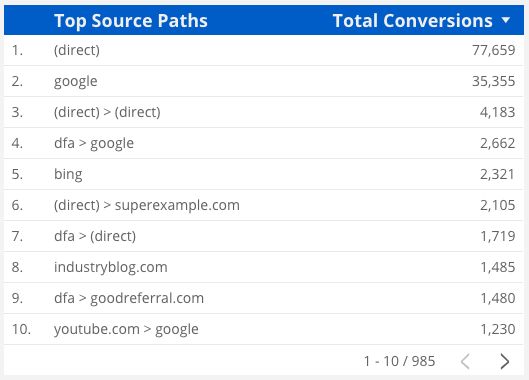
Hm, it looks like ads from DoubleClick Campaign manager (dfa) are a strong first interaction. We should look into that more in Google Analytics and DCM.
Limitations
- The multi-channel funnel data will pull up to 1 million conversions.
- Google Sheets has the limits of 400,000 cells and 256 columns per sheet, so keep that in mind if you are ever in a situation of pulling a lot of data.
- Like the MCF reports in Google Analytics, the reports will have a default lookback window of 90 days.
- MCF dimensions and metrics cannot be combined with the core Google Analytics dimensions and metrics.
- The data uses the default channel groupings. If you use a few custom channel groupings frequently, you may want to consider creating separate views and changing the default channel grouping for each.
Multi-Channel Funnel data is useful for analyzing multi-session touchpoints as a starting point for digging into insights around assisted conversions, AdWords paths, DCM paths, and a glimpse into sources that would normally be inflated because of the way (direct) traffic is handled in the standard reports. Adding it to your dashboard is a great way to supplement other traffic and attribution data that you may already have.


