I've Just Installed Google Analytics: Now What?

Google Analytics works great out-of-the-box for most users. Copy/paste the code onto your site (or set up through Google Tag Manager) and you begin receiving information about who your users are, how they’re arriving on your site and what pages they’re visiting.
Just the initial implementation gives you valuable reports that you can use to make decisions that span across departments – there’s information that can help you decide on which content to create, which types of users to target, where to spend your marketing money, and even technical information to help inform design and identify errors.
For some – this is where they stop. Implementation complete, check it off the list, and move on. But the default reports are just the tip of the iceberg, and hardly represent the full potential of Google Analytics.
By default, Google Analytics doesn’t know if your website is an ecommerce website, or one that focuses on lead generation, content marketing, or a simple informational site. Google Analytics doesn’t know what is important to you, what kinds of reports would be the most beneficial, or how you measure success.
There’s good news though – you can tell Google Analytics all of these things, and you can go from using “default” to using a highly customized tool that is built to provide you with the insights necessary to make more money, better content, and smarter decisions. Ready to go to work?
Google Analytics is CUSTOMIZABLE
Let’s assume for this post that you already have Google Analytics (GA) installed and that you’re ready to start making some changes. Some of the changes will require you to add code to your website, either through JavaScript or through a tool like Google Tag Manager. Others will require Edit Access within GA. And then there are some changes that anyone with any access can make inside the interface.
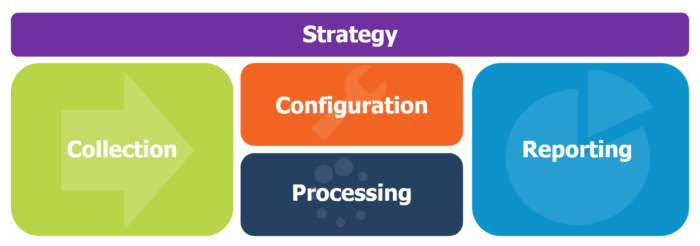
For help with these concepts, I’ll use GA’s approach to talking about the 4 main components of the Google Analytics platform.
If you’ve gone through the Google Analytics Academy, you’ll recognize this from the Platform Principles section. GA breaks down how it all works into 4 different phases.

This is how Google Analytics works, but these are not our only opportunities to customize. I’ll add an extra layer on top of that that we’ll call “Strategy.”
Plan Out Your Strategy
Everything starts with creating a strategy. Think about it as going backward before you can go forward. This is how we start projects with clients, and we’ve written a few posts about how to start your very own measurement strategy.
You need to think about your business and what’s important to you. What sort of information would you like to see in Google Analytics? What information will help you make better business decisions? These questions will help guide you when you’re searching for exactly how to customize GA.
Changes you make on your website or within the Google Analytics configuration should accomplish an objective or help answer questions that you have now or anticipate having in the future.
Below is a list of some of the most common ways to affect your data and customize analytics to suit your needs. Each one requires a little bit of strategy so it makes sense to put them all in the context of a larger measurement plan. This list won’t explain exactly how to accomplish everything, but should be used a stepping off point to plan your next steps.
Collection Phase
You’ve probably heard the phrase “Garbage In, Garbage Out.” If you follow the basic installation instructions, and avoid the common implementation mistakes, then you should be starting with quality data. But, this data can be made better.
I’d like to suggest a new phrase – “Great Data In, Great Data Out.”
The collection phase is all about the data that is coming into GA. Send better data and more data, and you’ll get a better, clearer image of who’s coming to your site, how they arrive, and what they do.
Better Traffic Information with Campaigns
When you are sending traffic to your website from any outside source, you have the unique opportunity to tell GA where this traffic is coming from. This can work for other websites that you share information and offline or online marketing campaigns.
This customization is actually one of the easiest to begin implementing! It happens entirely off of your website, doesn’t require any configuration, and doesn’t require any updates to code on your website. Instead, you just need to pass the right information to GA when you’re sending traffic to your website from somewhere that you know. We call this process “campaign tagging.”
Google automatically tries to figure out where visitors are coming from before they land on your website. If they come from search engines, they’ll be classified as organic, if they come from a paid search campaign and it’s been set up correctly, they’ll be classified as paid traffic.
There are some things that GA can figure out automatically based on the last page the person was on before they arrived on your website. However, Google doesn’t know what specific marketing campaigns you’re running. Are you sending email campaigns? Are you posting on social media?
GA might be able to show you that someone is coming from Facebook or from Twitter, but unless you tell it more information, GA won’t know if they’re coming from organic shares, a specific campaign, a sponsored post, or a contest that you’re running.
Here’s where campaign tagging comes into play. If you’re posting a link somewhere, you can include extra information about that link. When you post an article on Twitter, or Facebook, or LinkedIn, you simply append a few special parameters to the end of the URL that tells GA exactly where you put the link and why. These parameters are custom to Google Analytics and they will automatically show up in your GA reports if anyone visit your website with those parameters intact. It looks like this:
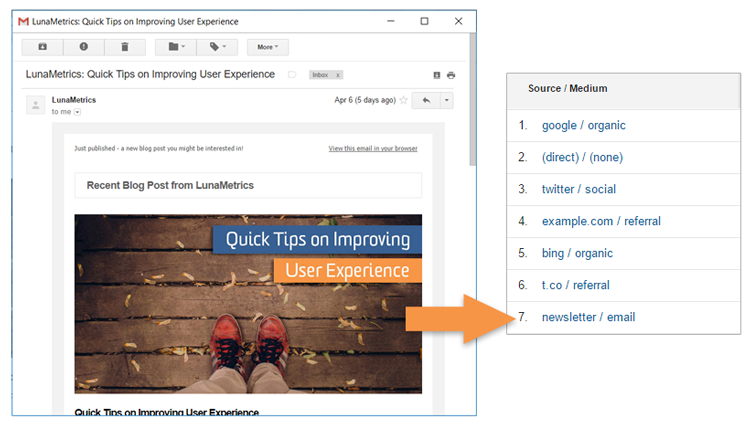
If someone comes from an email campaign that I’m running, I’ll tell GA that their medium should be classified as “email,” I’ll set their source to show the particular list that I sent this email campaign to, and then the campaign might be details about the specific email that I’m sending out. Is it a contest? Is it a reminder?
This simple step will enable me to see which campaigns result in the most amount of traffic to my website, and later I’ll be able to actually tell which campaigns are most effective in driving conversions (goals or transactions).
More Reading
- Google Analytics: Custom Campaigns
- Google Analytics: URL builder
- Bounteous: Google Analytics Campaign Tagging Tool
- Bounteous: 4 Steps to Better Campaign Data in Google Analytics
- Bounteous: Naming Events and Traffic Sources for Easier Reporting in Google Analytics
Tracking More Than Pageviews
By default, GA tracks what pages are loaded on your website. And that’s it. But there are many other things that happen on your pages besides just loading. Users take many actions – they may scroll, they may download files, they may submit forms. All of these things can be tracked inside of GA so you can see exactly what users are doing.
We can use something called “event tracking” to pass in actions that occur on your page after the page has loaded. You get to choose which actions you would like to track, you get to choose what they’re called, what information is collected, and exactly how it will appear in your reports.
Event tracking must be placed on your website. Sometimes this is as easy as enabling a plug-in for your website, if you’re using a common platform like WordPress. Sometimes you’ll need to add this to your site via JavaScript/jQuery – either setting this up yourself or asking a developer to help you. If you have Google Tag Manager (GTM) already on your page or you can get GTM on your page, this may be as simple as importing a few recipes, like the GTM Recipes that we’ve created, or adding your own events via tags and triggers inside of GTM.
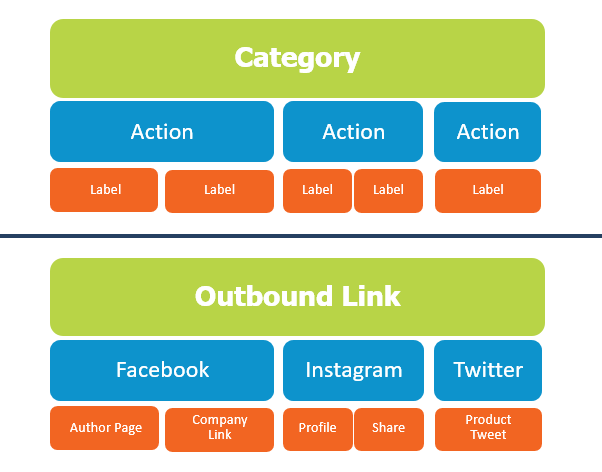
Any way you do it, you have to be able to implement these changes on your website. When someone performs an action on your website, you can tell Google Analytics what action they took, and more details about that interaction. It looks like this:
Some common events to track:
- File Downloads
- Contact Form Submissions
- Clicks on Emails or Phone Numbers
- Outbound Link Clicks
Smart event tracking implementation is helpful for so many reasons! Better data and more information to report on is just one of them. Strategic implementation will also help you more accurately record time on site as well as bounce rate. Imagine one of those connect-the-dots images that you completed as a child. The more dots that you connect, the clearer the picture becomes. The same is true with Google Analytics, the more information we send to GA, the more accurate our reporting will become.
More Reading
- Google Analytics: About Events
- Bounteous: Google Tag Manager Recipes
- Bounteous: Non-Interaction Events in Google Analytics
- Bounteous: Naming Events and Traffic Sources for Easier Reporting in Google Analytics
Ecommerce Information
Ecommerce websites work so well with Analytics, but it definitely requires implementation work on your website. If someone is purchasing something on your website, you pass all of the information about that purchase to Google Analytics to unlock some really great reports and begin to assign value to the various channels that are driving traffic to your site.
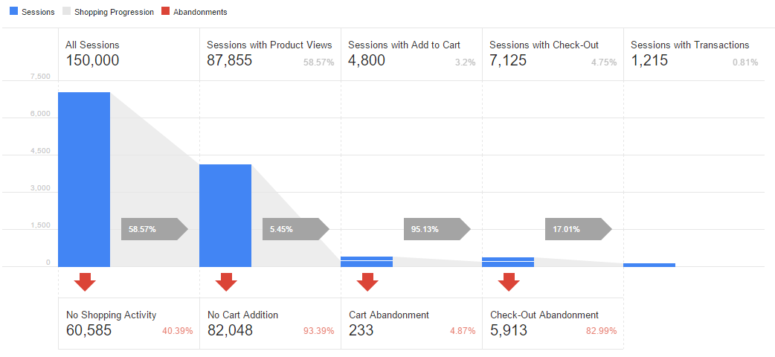
This option must be enabled in Google Analytics and then you have to make the changes on your site. There are two main flavors of ecommerce – regular and enhanced. Enhanced ecommerce is the newest for Universal, it’s free for everyone, and really gives you a number of amazing reports. Those great reports come from sending in more data to GA. Remember that connect-the-dots image?
So figure out which version of ecommerce you need and set this one up, immediately!
More Reading
- Google Analytics: About Enhanced Ecommerce
- Bounteous: Frequently Asked Questions About Enhanced Ecommerce
- Bounteous: Google Analytics Enhanced Ecommerce: The Order of Implementation
Tracking Custom Information
Here’s where we really get to get creative! There’s an extensive list of dimensions and metrics that are included with Google Analytics. Remember dimensions are the categories that your users, sessions, and hits are bundled into, and metrics are the numbers or measurements about those categories. So “Page” is a dimension and “Pageviews” is a metrics. Check out some of the basic definitions here.
With Universal Analytics, we actually have the option to add our own Dimensions and Metrics! These are called, not surprisingly, “custom dimensions and metrics.” This is again your opportunity to customize GA to match your particular site.
Again, think about what information will help you make decisions. If you have content on your website, would viewing blog traffic by author be a valuable report? You can actually create a custom dimension called “Author” and then pass the information to Google Analytics.
This too requires the ability to modify your website – either through editing the code, using GTM, or a plugin. The information needs to come from… somewhere! Often we can use our CMS or website platform to surface information about the particular page or user. Sometimes we need to wait until a user gives us information.
For example, if someone fills out a form on our website and indicates their industry with a dropdown, you can capture that value and save into a custom dimension called “Industry” inside of GA. Then, anytime that person returns, Google Analytics will remember which industry that person belongs to. The user-scoped custom dimensions are great for defining audiences that you can use for reports or even to use with advertising.
More Reading
- Google Analytics: Custom dimensions & metrics
- Bounteous: How to Report Custom Dimensions in Google Analytics
- Bounteous: 20 Ways to Use Google Analytics Custom Dimensions
Processing/Configuration Phase
Most of the previous options require the ability to make changes on your website. This next section does not, which is great for people without the technical knowhow or proper access to make those changes.
Some of these changes will help clean up your data, while others will actually give you more data and more reports to work with.
What Are Your Users Searching For?
Most website have some form of site search that allows users to enter a term and find results on your particular site. Knowing what users search for on your website can be valuable for finding which information is hard to find naturally, the specific language and keywords that your visitors are using, and perhaps suggestions for content you should be offering.

Better yet – this information is actually really easy to bring into GA and will filter directly into the Site Search reports that are nested under the Behavior section.
This configuration setting can be found under the View Settings and relies on the existence of a query parameter in the results page URL. You specify the search term, usually something like “q” or “s”, and GA takes care of the rest!
If you don’t have a query parameter in your search results URL, there might still be hope for you, check out this links below.
More Reading
- Google Analytics: Set up Site Search
- Google Analytics: Leverage internal site search
- Bounteous: Site Search in Google Analytics – With or Without Query Parameters
What Matters To You? YOUR Goals
Now we’re back to the part where you tell GA what you care about. What is the purpose of your website and how will you measure that? Often this is just to purchase something, in which case ecommerce tracking will take care of that. But there are often other things we want to identify as being important.
Inside of GA, also under the View settings, is a section called “Goals.” This arguably one of the most important settings you can configure inside of GA.
We use Goals to tell Google what we care about and to flag a particular session as a “Conversion.” You can set up Goals for when a user hits a certain page, sends in a particular event, stays on the website for a certain amount of time, or views a certain number of pages.

- Destination Goal – We’re already tracking what pages people are visiting just with the default code. This option lets us say that one particular page is the most important. This is often a “Thank You” page or an “Order Confirmation” page.
- Event Goals – If we’ve already set up event tracking, then we’re now able to see the particular actions that people are taking on our site. This is great for reporting! Event Goals pull out a particular event that is more important than others. Maybe it’s a PDF download, maybe it’s calculator, or particular form that is filled out.
- Engagement Goals – These goals measure that someone is has been on our site for a specific amount of time or looked at a certain number of pages. It’s a great way to see which channels are driving more engaged users to your website.
Goals shouldn’t be “easy” to complete, rather Goals should be something that we’re striving to get people to complete. If we’re trying to get more leads from our website, we may set the Thank You page as a destination goal or use and event and an event goal to track that they submitted the form successfully. Now we can compare to see which marketing campaigns are resulting in the most number of leads.
Important to note, Goals don’t actually add any code to your page or influence metrics like Bounce Rate or Time on Site. Goals are used to simply say which sessions met certain criteria, or which sessions “converted.”
Goals and Ecommerce open up a host of new metrics that we can begin using to quantify and measure our traffic and our Users.
More Reading
Clean Up Your Data
Creating a Google Analytics property will automatically create one view for you, called “All Web Site Traffic.” This is where you’ll find all of your reports about anyone that visits a website with your particular tracking ID on it. Again, this is good to use right out of the box – but it can be made better!
We recommend creating separate views to help make reporting easier and to begin using filters to help with some common problems and reporting needs:
- Filter out internal traffic like employees and vendors
- Fix issues with capitalization
- Filter out some issues with spam
- Only show certain countries or segments of data
Lastly – you can either use the View settings or filters to clean up extra query parameters on your URLs that don’t add any value to your reports and split your pages into separate rows.
More Reading
- Google Analytics: About view filters
- Bounteous: Basic Google Analytics Filters for Every Site
- Bounteous: Identifying and Filtering Internal Traffic from Google Analytics
Connecting The Dots With More Information
Google Analytics automatically will sync with other systems to bring in data from Google Ads, DoubleClick, Google Search Console, and more! If you’re using any of these systems, you just need to make the connection to begin bringing that data right into GA.
You’ll find all of those options under your Property settings!
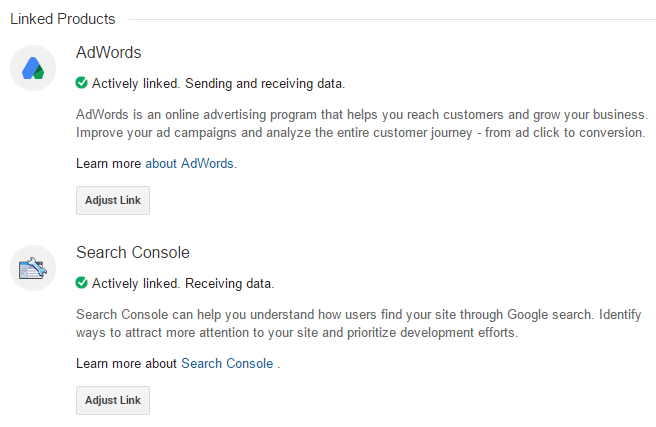
Most people have other systems in place besides the Google products. Some systems will connect automatically with GA, like the Marketo integration, while others will require extra work to connect the systems, like Salesforce.
Just remember, the more data you’re putting into GA, the more options you have for valuable reporting.
More Reading
- Bounteous: Linking Google Ads to Google Analytics & Webmaster Tools
- Bounteous: Connecting DoubleClick for Publishers to Google Analytics
- Bounteous: Data Import Step-by-Step Guide for Google Analytics
- Bounteous: Extending Google Analytics with Programmatic Data Import
Reporting Phase
The Reporting part of Google Analytics is the one that most people are aware of, and many only scratch the surface.
This is also one of our most talked about sections, so you’ll find lots of great examples on our blog about different ways to enhance your reporting, distribution, and more!
Using Reports for Monitoring
There are various ways to set up GA to send data to you, rather than logging in every day to get data. Intelligence Events and scheduled emails can help with daily and weekly monitoring, and can apply to every department that touches the website.
Technical issues with the new website launch? Get an alert letting you know about a dropoff in traffic from a particular buggy browser (not mentioning any names…)
New campaign really taking off? Get an alert with the big change in traffic from your new marketing source. Weekly emails can be sent from almost any report or dashboard.
More Reading
- Bounteous: Google Analytics Power Reporting for SEO and PPC
- Bounteous: Basic Reporting Automation with Google Analytics
Check Out The Solutions Gallery
Other people have already the work, you just get to benefit from their efforts! Check out the Google Analytics Solutions Gallery to import almost anything customizable into your GA.
Custom Reports, Dashboards, Segments, Channel Groupings, you name it!

You’ll find solutions from the top partners in the world, analytics rock starts like Cutroni and Avinash, and a few from your favorite Analytics blog. (Pst… that’s us!) This is a great way to learn how others set up these items within Google Analytics. Take, import, modify, and learn from others that have done well! Search for channel specific info, like Social Media dashboards or Paid Search dashboards.
More Reading
Get The Data Out Of Google Analytics
Now that you have the data in GA – you can really take it anywhere! We love talking about bring that data into Google Sheets as well into Excel, or Tableau, or R, or … the list goes on!
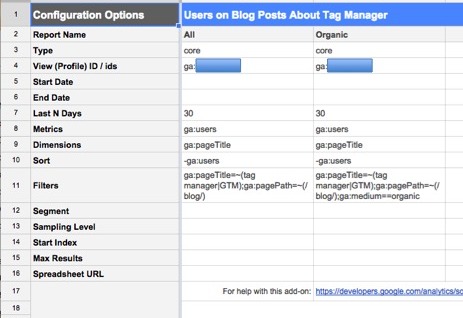
There are a number of great tools out there to help you with this. Via the Google Analytics APIs, you can access the information and do pretty much anything you want with it.
Make the data work for you in the environment that you need or that will best fit your reporting needs.
More Reading
- Bouneous: Bringing Google Analytics Data into Google Sheets
- Bounteous: Google Sheets and Google Analytics Part 2: Segments and Filters
- Bounteous: Getting Started with ShufflePoint
- Bounteous: A Better Way to Connect Tableau and GA
- Bounteous: Getting Started with R and Google Analytics
Get Creative
That data in GA can accomplish many objectives. It can inform the various departments in your company or provide high-level information for the health of your website. It can connect to various other tools for visualizations, it can connect to various tools for advanced advertising. Really, the sky’s the limit!
Think about creative uses for your data!
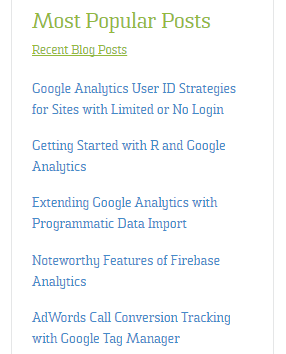
For instance, check out our blog sidebar that shows the most popular blog posts. That’s fed dynamically from the Google Analytics Core Reporting API and updates every hour.
Got a TV or Display set up in your office? Throw up some Google Analytics info! We’ve got a pretty basic one set up in our lobby, and people can’t help but stop on their way to the kitchen to see what blogs are currently trending or which states are driving the most traffic to the site. We use the Google Analytics Real-Time API to update the data every 30 seconds, and it’s fun to see a blog post take off in real-time as it’s published and tweeted.
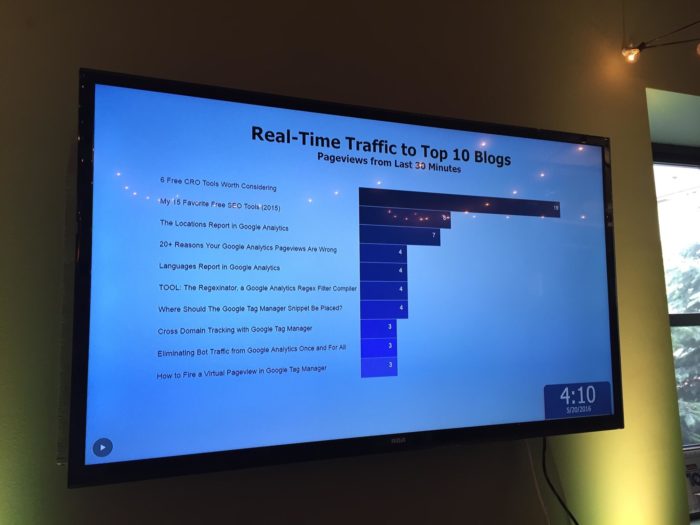
This type of reporting takes a little more programming effort. You have to connect with the API, throw into a visualization engine, and have a way to connect it to a TV. But it helps to make the website a more visible component of your business.
More Reading
Hopefully you’ve come out of this blog with your next steps, post-default installation! Putting time and effort into customizing Google Analytics for your business pays off dividends in the long run.


